Breakout Trades and the Power of Price Channels
Introduction: Why Price Channels Matter for Breakout Traders
In professional forex trading, Price Channels, commonly known as Donchian Channels, are a powerful yet simple technical tool used to identify market structure, volatility boundaries, and breakout opportunities. These channels highlight the highest high and lowest low over a defined period, giving traders a clear visual framework for support and resistance.
For traders—especially beginners—Price Channels offer a structured way to understand where price has been and where it may go next, making them particularly effective for breakout trading strategies.
Understanding Price Channels (Donchian Channels) on the Daily Chart
When Price Channels are applied to a chart, they automatically plot:
- The upper channel line → highest price over a selected period
- The lower channel line → lowest price over the same period
In this example, the Price Channels are set to 20 periods on a Daily chart, meaning:
- The upper line represents the highest price over the past 20 trading days
- The lower line represents the lowest price over the past 20 trading days
This configuration allows traders to clearly identify key support and resistance zones without subjective drawing.
Using Price Channels to Identify Support and Resistance
One of the strongest advantages of Price Channels is their ability to objectively define support and resistance:
- Lower channel line → acts as support
- Upper channel line → acts as resistance
Breakout traders focus on moments when price decisively breaks beyond these boundaries, signaling that momentum may continue in the breakout direction.
This approach aligns well with classic trend-following and momentum-based trading principles widely used in institutional and retail forex trading.
Breakout Trading Logic: How Entries Are Formed
A breakout trade occurs when:
- Price breaks below support during a downtrend, or
- Price breaks above resistance during an uptrend
When such a breakout happens, it often indicates that:
- Market participants are entering aggressively
- Volatility is expanding
- Price may continue moving in the same direction for a sustained period
This makes Price Channels especially useful for traders who prefer clear, rule-based entry signals rather than discretionary decision-making.
Price Channels Example on a Daily Chart
Below is an example of Price Channels applied to a Daily timeframe:
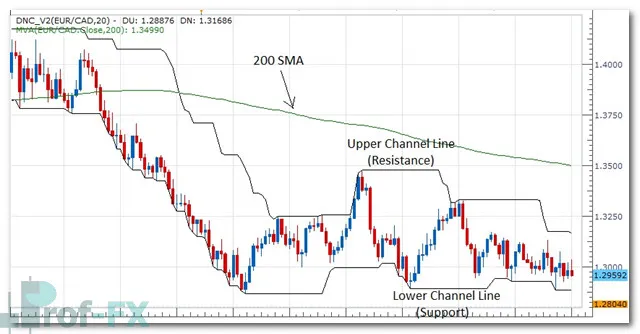
As shown:
- The lower channel line clearly defines support
- The upper channel line clearly defines resistance
This structure provides a clean visual map for anticipating potential breakout scenarios.
Step One: Determining Trade Direction (Top-Down Analysis)
Before entering any breakout trade, professional traders always define market direction first.
In the case of the EURCAD currency pair, a bearish (short) bias is justified for several reasons:
- Price Action is trading below the 200 Simple Moving Average (200 SMA) and continuing to move away from it
- At the time of analysis, the Euro (EUR) is fundamentally weaker than the Canadian Dollar (CAD)
- Price has formed a clear pattern of lower highs on the Daily chart since late February, confirming a downtrend
These factors combine technical trend confirmation with relative currency strength, increasing the probability of successful breakout trades.
Refining the Entry Using a Lower Timeframe
Once the directional bias is established on the Daily chart, the next step is to fine-tune the entry using a lower timeframe.
For this setup, the 1-hour (H1) chart is used, as it offers:
- More precise entries
- Better risk-to-reward control
- Clear intraday breakout signals
Adjusting the Price Channel Settings
When moving from a Daily chart to an intraday timeframe:
- The Price Channel period is increased to 55 periods
This adjustment helps:
- Smooth out market noise
- Slow down the indicator to better reflect meaningful price movements on faster charts
Price Channel Breakout Entry on the 1-Hour Chart
Below is the intraday setup using Price Channels on the 1-hour chart:
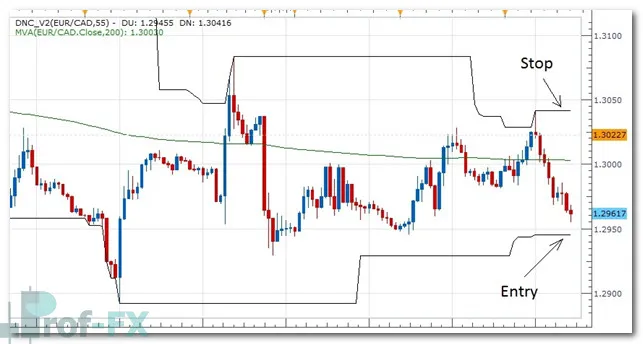
Trade Execution Example:
- Sell Entry: When price breaks below the lower channel line at 2941
- Stop Loss: Placed above the upper channel line at 3041
This approach provides:
- A clear breakout-based entry
- A logical, technically justified stop placement
- A rules-based structure that removes emotional decision-making
The Price Channels effectively define both entry and risk management levels.
Managing the Trade: Trailing Stops with Price Channels
Trade management is just as important as entry.
As the trade progresses:
- The stop loss is manually trailed just above the upper channel line
- This allows the trader to:
- Lock in profits
- Stay in the trade as long as momentum continues
Trade Exit Rule:
- The position is closed when price retraces upward and intersects the upper channel line, triggering the stop
This exit method ensures that:
- Profits are protected
- Trades are exited objectively, not emotionally
Key Takeaways for Beginner Forex Traders
- Price Channels (Donchian Channels) are excellent tools for identifying breakouts
- They provide objective support and resistance levels
- Combining Price Channels with:
- 200 SMA
- trend structure
- relative currency strength
significantly improves trade quality
- Using top-down analysis (Daily → H1) leads to more disciplined entries
- Trailing stops along the channel help maximize gains while controlling risk
Final Thoughts
Breakout trading with Price Channels offers a structured, professional approach suitable for both beginner and experienced forex traders. By combining trend confirmation, breakout logic, and disciplined trade management, traders can participate in strong market moves with clarity and confidence.
If applied consistently and combined with sound risk management, this strategy can become a reliable component of a long-term forex trading plan.