


The Camarilla Pivot Point is a highly practical technical indicator that helps traders identify key price levels, including potential entry points, exit targets, and risk management zones. Widely used by short-term and intraday traders, Camarilla pivots adapt well to changing market conditions, making them a flexible tool across different trading sessions and asset classes.
The effectiveness of a Camarilla pivot trading strategy largely depends on current market structure—whether price is ranging, trending, or transitioning between the two. Understanding these conditions allows traders to apply the most suitable Camarilla-based approach with greater confidence and consistency.
In this guide, we will explore the essential concepts every trader should understand:
- What Camarilla pivot points are
- How Camarilla pivot points are calculated
- Proven Camarilla pivot trading strategies
- Advantages and limitations of Camarilla pivot points
What Are Camarilla Pivot Points?
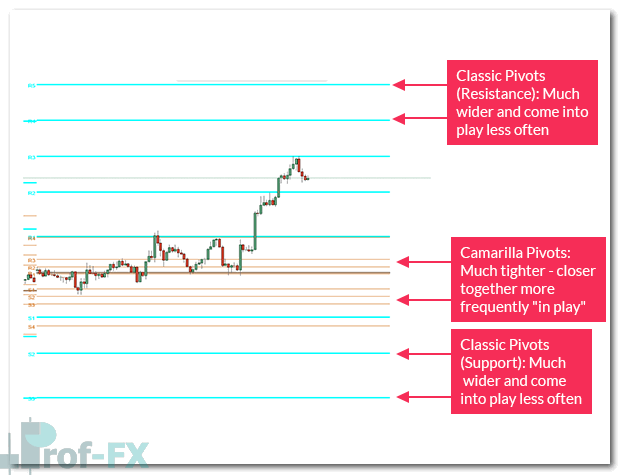
Camarilla pivot points are an advanced variation of the classical (floor trader) pivot point system, designed to provide traders with tighter and more reactive support and resistance levels. Unlike traditional pivot points, Camarilla pivots consist of four support levels (S1–S4) and four resistance levels (R1–R4), positioned much closer to price.
This proximity makes Camarilla pivots especially suitable for short-term trading, such as day trading, scalping, and session-based strategies in markets like forex, indices, commodities, and CFDs.
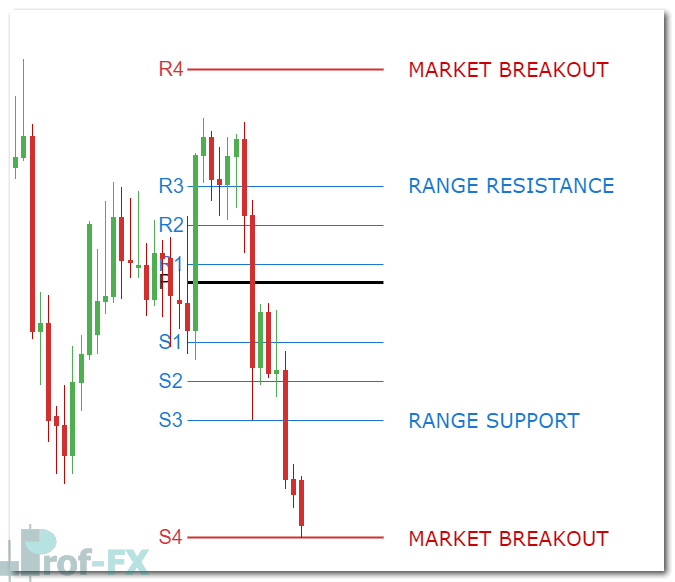
The core idea behind Camarilla pivots is rooted in mean reversion and breakout behavior. Price is expected to rotate between inner levels (S3–R3) during normal market conditions, while breaks beyond extreme levels (S4 or R4) may signal strong directional momentum.
Modern traders can easily apply Camarilla pivots using most trading platforms, while platforms such as Prof FX provide hourly, daily, weekly, and monthly Camarilla pivot levels to help traders assess overall market sentiment and intraday bias.
Camarilla Pivot Formula Explained
Camarilla pivot points are calculated using the previous trading period’s high, low, and closing price, making them objective and universally applicable.
Below is the standard Camarilla calculation formula:
- R4 = Close + ((High − Low) × 1.5000)
- R3 = Close + ((High − Low) × 1.2500)
- R2 = Close + ((High − Low) × 1.1666)
- R1 = Close + ((High − Low) × 1.0833)
- Pivot Point (PP) = (High + Low + Close) / 3
- S1 = Close − ((High − Low) × 1.0833)
- S2 = Close − ((High − Low) × 1.1666)
- S3 = Close − ((High − Low) × 1.2500)
- S4 = Close − ((High − Low) × 1.5000)
These calculated levels form a dynamic framework of intraday support and resistance, which updates automatically with each new trading session.
Camarilla Pivot Trading Strategies
There are several ways to trade using Camarilla pivot points. Below are two of the most widely used and effective Camarilla strategies, each suited to different market conditions.
1. Camarilla Pivot Range Trading Strategy
A range-bound market occurs when price oscillates between well-defined support and resistance levels without establishing a strong directional trend. Camarilla pivots are particularly effective in such conditions because they reset daily, offering fresh levels for short-term opportunities.
In range trading, the primary focus is the area between S3 and R3, commonly referred to as the daily trading range.
- Traders look to sell near R3 when price shows signs of rejection
- Traders look to buy near S3 when price finds support
The assumption is that price will revert toward the mean rather than break out.
This strategy tends to perform best during low-volatility trading sessions, such as the Asian session, when institutional participation is lighter and price movements are more controlled.
However, traders should remain cautious, as price can remain range-bound for extended periods or suddenly transition into a breakout phase.
2. Camarilla Pivot Trend Trading Strategy
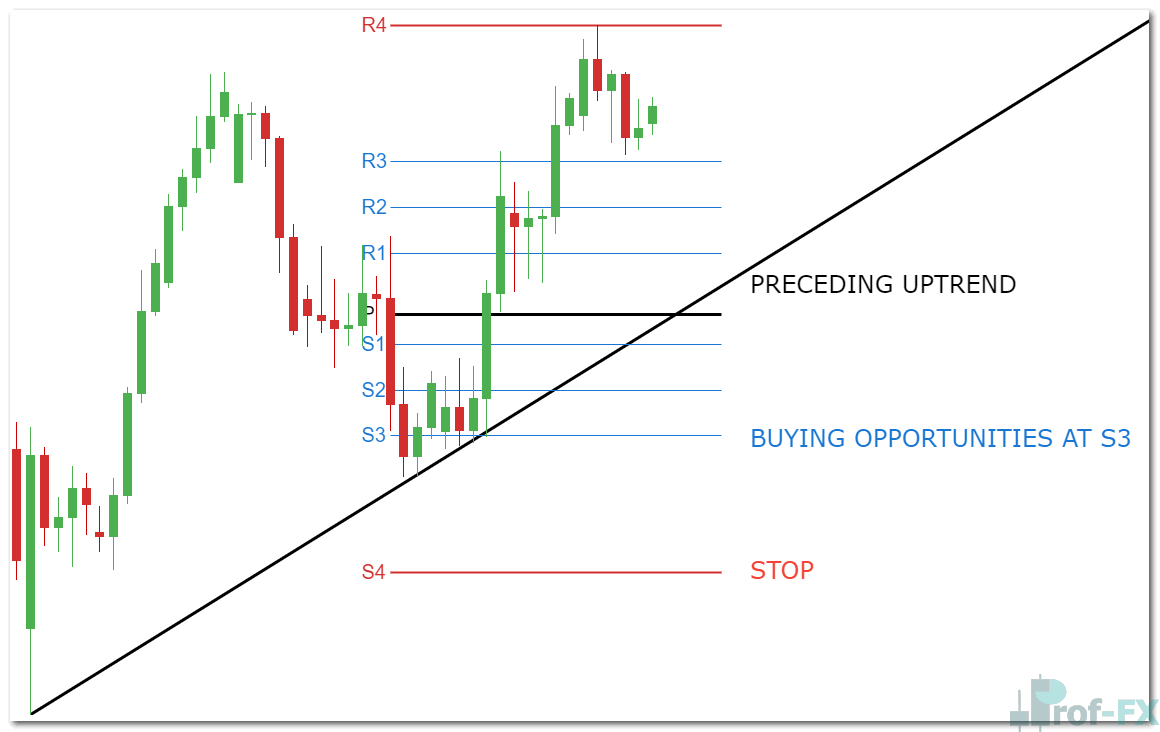
When markets are trending, Camarilla pivots can be used as dynamic pullback zones rather than reversal points.
In an uptrend:
- Look for buying opportunities near S3
- Place protective stops near S4
In a downtrend:
- Look for selling opportunities near R3
- Place protective stops near R4
This strategy emphasizes trend alignment, ensuring traders are not fighting strong momentum. Trend direction can be identified using price action, moving averages, or market structure analysis.
Take profit levels are flexible and may be determined using:
- Fibonacci retracements or extensions
- Key price action levels
- Previous highs or lows
Advantages and Limitations of Camarilla Pivot Points
Advantages
- Highly effective for short-term and intraday traders
- Provides clear entry, stop-loss, and risk management levels
- Works across all financial markets, including forex, stocks, indices, and commodities
- Objective calculation reduces emotional decision-making
Limitations
- Less suitable for long-term positional trading
- Can be challenging for beginner traders without proper market context
- Using the wrong strategy in the wrong market condition can increase losses
Understanding when to apply range strategies versus trend strategies is essential for consistent performance.
Further Learning on Pivot Point Trading
To deepen your understanding of pivot-based trading strategies, consider exploring related topics such as:
- Classical (Floor Trader) Pivot Points for foundational knowledge
- Woodie Pivot Points as an alternative pivot variation
- Support and resistance trading concepts for contextual analysis
Platforms like Prof FX provide professional-grade forex news, technical analysis, and pivot point data to help traders stay aligned with global market trends and macroeconomic influences.


