


The Spinning Top candlestick pattern is one of the most informative components within the Japanese candlestick universe. Recognized primarily as a symbol of market indecision, this pattern can offer traders valuable context when analyzing ongoing price action or planning entries and exits.
In this article, we will explore the following key points:
- What the Spinning Top candlestick pattern represents
- How the Spinning Top is formed from a price-action perspective
- Practical techniques for trading the Spinning Top candle
- Additional resources to deepen your candlestick knowledge
Understanding the Spinning Top Candlestick Pattern
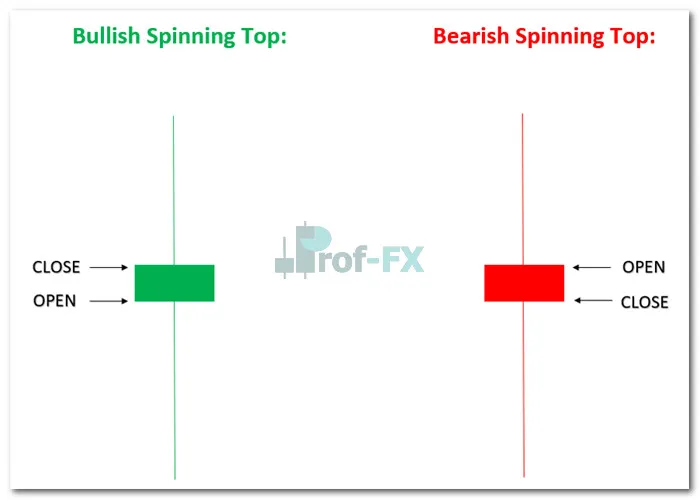
The Spinning Top is a single-candle formation signaling hesitation between buyers and sellers. Characteristically, it features a small real body positioned between two long, nearly symmetrical wicks, reflecting significant intraperiod volatility but minimal net progress in either direction.
A Spinning Top may close either bullish or bearish, yet its meaning remains rooted in uncertainty. It often appears during uptrends, downtrends, or sideways markets, where it can act as a potential precursor to a reversal, especially when forming at critical support or resistance levels.
How the Spinning Top Candlestick Develops on the Chart
The price behavior inside a Spinning Top illustrates a tug-of-war between market participants. Buyers drive price higher, sellers push it lower, and neither gains lasting control—resulting in a close price that settles at or near the opening level. This dynamic encapsulates true indecision.
One of the strengths of incorporating Spinning Tops into a trading strategy is their visual simplicity. They are easy to identify, making them a useful confirmation tool even for beginner traders.
It’s worth noting that, structurally, the Spinning Top shares similarities with the Doji, but with a noticeable difference:
the Spinning Top typically has a slightly wider body, highlighting a modest yet meaningful range of price movement during the candle’s lifetime.
How to Trade the Spinning Top Candle Effectively
Successful use of the Spinning Top pattern requires understanding both its formation and its location within the prevailing market trend. Below is an applied example demonstrating identification, confirmation, and practical execution within a forex context.

In the EUR/NZD chart example, a bearish Spinning Top emerges at the peak of an established uptrend, defined by the golden trend line. The candle reflects a loss of momentum from buyers, followed by increased selling pressure—ultimately signaling a potential reversal.
Traders should avoid executing a trade immediately after spotting the pattern. Instead, they should wait for confirmation, which may come from:
- Technical indicators (e.g., moving averages, trend lines)
- Fundamental catalysts (e.g., macroeconomic news, sentiment shifts)
- Oscillators, such as the stochastic oscillator, which in this scenario validated a short entry at the point marked in blue
A widely accepted confirmation method involves waiting for the next candle to close beyond the Spinning Top’s wick in the direction of the anticipated reversal. Without this confirmation, the signal remains speculative.
Key Takeaways for Trading the Spinning Top Pattern
- Identify a candle with a small body and long wicks on both sides.
- Assess the broader market trend using trend lines or technical indicators.
- Always wait for confirmation before entering a trade.
- Once validated, execute a trade aligned with the directional bias.
In summary, the Spinning Top reflects a state of equilibrium—or uncertainty—between buyers and sellers. When found near critical price areas or within a mature trend, it can be a valuable indicator of potential market reversal. Its effectiveness increases significantly when combined with broader technical or fundamental analysis.
Further Learning: Enhancing Your Candlestick Trading Skills
- Deepen your understanding of chart behavior with our guide to the top 10 candlestick patterns and how to trade forex candlesticks.
- Explore a complete introduction to technical analysis to build a strong chart-reading foundation.
- Study various trading styles and forex trading strategies to determine which methodology aligns best with your trading psychology and risk tolerance.
Prof FX provides forex news, market insights, and technical analysis centered on global currency trends.


 Explained")


