Understanding the Dark Cloud Cover in Price Action Trading
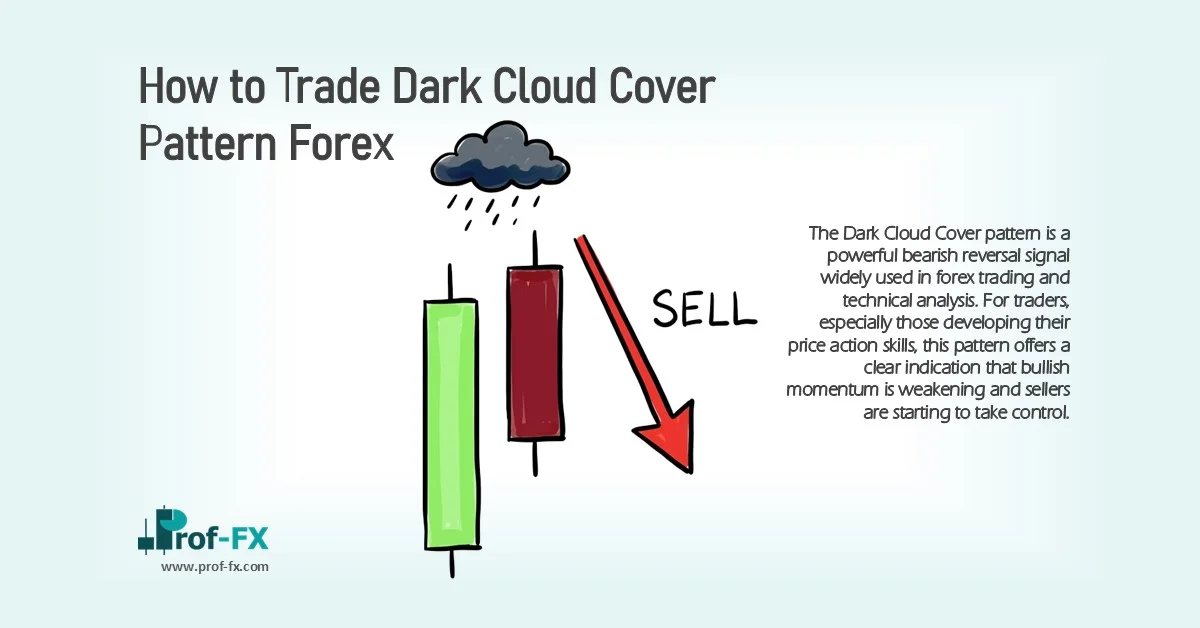
The Dark Cloud Cover pattern is a powerful bearish reversal signal widely used in forex trading and technical analysis. For traders, especially those developing their price action skills, this pattern offers a clear indication that bullish momentum is weakening and sellers are starting to take control.
While the pattern is relatively easy to identify, professional traders never rely on it alone. Instead, they combine it with indicators, trend structure, and key resistance levels to improve accuracy and achieve favorable risk-to-reward ratios.
In this guide, we will cover:
- What the Dark Cloud Cover pattern is
- How to identify it correctly on forex charts
- Practical strategies to trade it effectively
- Its advantages and limitations
Before continuing, make sure you are comfortable reading candlestick charts, as this pattern depends on understanding candle structure.
What Is a Dark Cloud Cover Pattern?
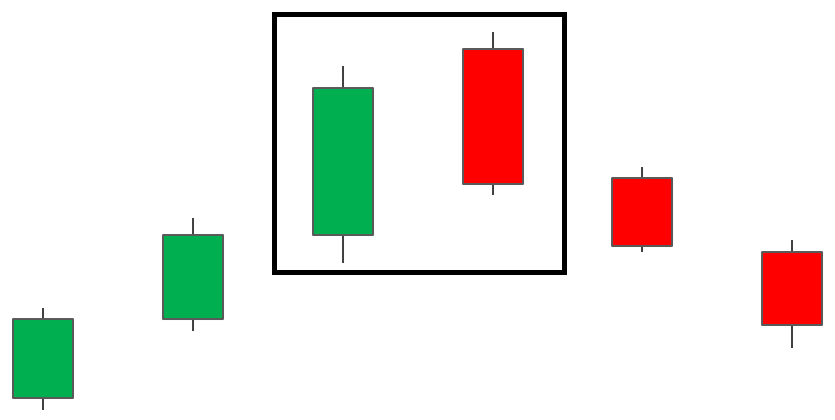
The Dark Cloud Cover is a two-candlestick bearish reversal pattern that forms at the top of an uptrend.
Structure of the Pattern
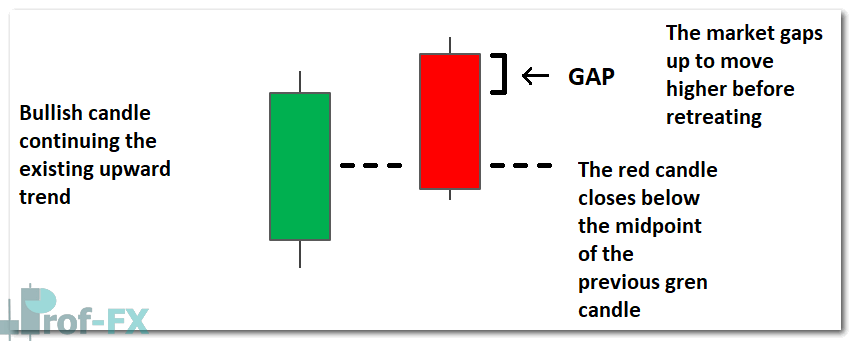
This pattern consists of:
- A strong bullish (green) candle, reflecting continued upward momentum
- Followed by a bearish (red) candle that:
- Opens above (or near) the previous candle’s high
- Closes below the midpoint of the previous bullish candle
This shift shows that although buyers initially pushed price higher, sellers stepped in aggressively, reversing momentum.
Dark Cloud Cover vs Bearish Engulfing
Although similar, the Dark Cloud Cover differs from the bearish engulfing pattern:
- The bearish engulfing fully covers the previous candle
- The Dark Cloud Cover closes below the midpoint but not necessarily below the entire candle body
This often results in more precise entry levels, which can improve trade positioning.
How to Identify a Dark Cloud Cover on Forex Charts
To correctly identify this pattern, traders should follow a structured checklist.
Dark Cloud Cover Identification Checklist
- Confirm a clear uptrend (higher highs and higher lows)
- Look for signs of weakening bullish momentum:
- Overbought conditions on RSI (Relative Strength Index)
- Bearish crossover signals
- Slowing price movement
- Observe the second candle:
- Opens near or above the previous high
- Closes below the midpoint of the bullish candle
- Seek confirmation of continued bearish movement
Forex vs Stock Market Behavior
In forex markets, candles usually open near the previous close due to 24-hour trading.
In stock markets, however, gaps are more common:
- The bearish candle may clearly open above the previous candle
- This makes the pattern visually more pronounced
How to Trade the Dark Cloud Cover Pattern
The Dark Cloud Cover can be applied in both trending markets and ranging conditions, making it a versatile tool.
Strategy 1: Trading in Trending Markets
The pattern is most effective when it appears after a strong uptrend, such as on major pairs like GBP/USD or EUR/USD.
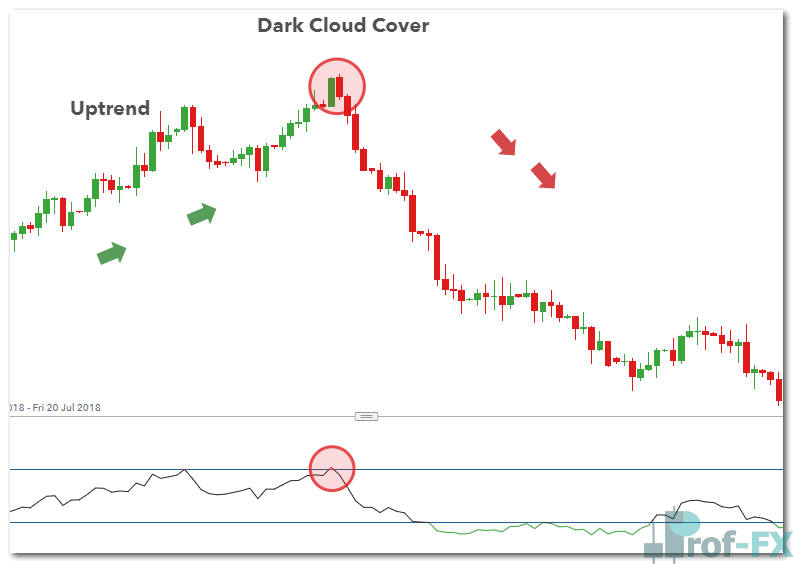
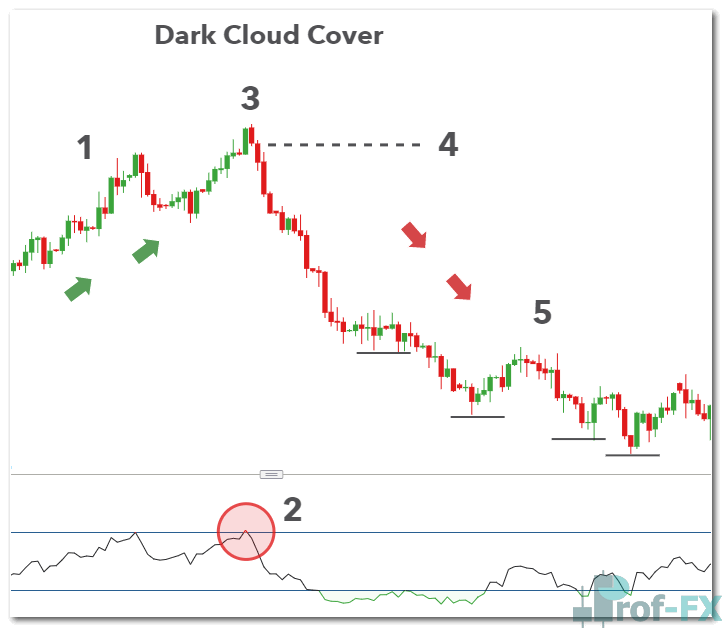
Market Analysis Example
- The market forms higher highs and higher lows → confirms uptrend
- Price begins to slow down or consolidate
- RSI enters overbought territory → signals potential exhaustion
- A Dark Cloud Cover pattern forms at the top
This combination increases the probability of a reversal.
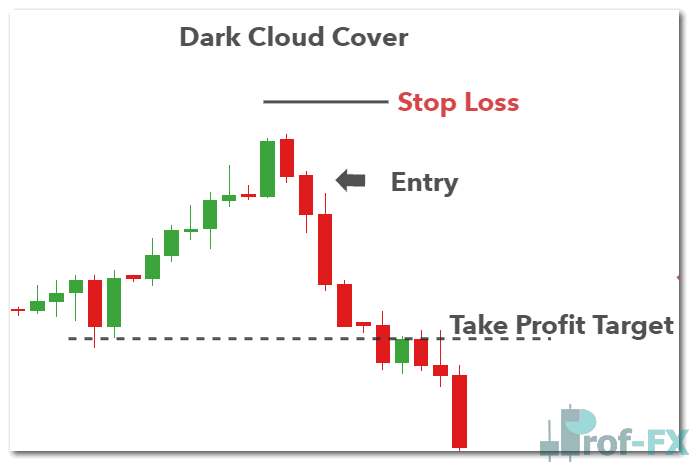
Trade Setup
Entry:
Enter at the open of the next candle after the pattern is confirmed.
Stop Loss:
Place the stop above the recent swing high.
Take Profit:
Target nearby support levels. Since the pattern may signal the start of a larger downtrend, consider:
- Multiple targets
- Trailing stop strategies
Strategy 2: Trading in Ranging Markets
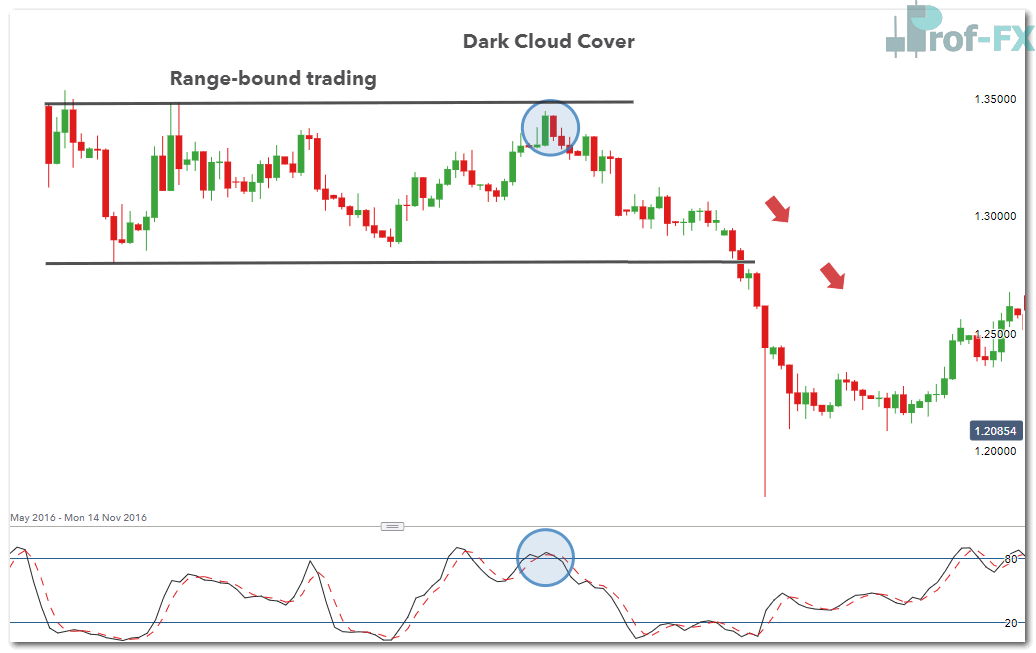
The Dark Cloud Cover is also effective in sideways markets, where price moves between support and resistance zones.
Market Context
- Price consolidates within a defined range
- The pattern forms near resistance
- Sellers reject higher prices
This setup offers a strong short signal, and if momentum increases, it may even lead to a breakout.
Trade Approach
- Enter after confirmation of bearish movement
- Place stop above resistance
- Target support levels within the range
Advantages and Limitations of the Dark Cloud Cover
Like all candlestick patterns, the Dark Cloud Cover must be evaluated within context.
Advantages
- Provides attractive entry levels near market tops
- Offers better risk-to-reward potential than some other patterns
- Easy to identify, even for beginner traders
Limitations
- Should not be traded in isolation
- Requires confirmation from indicators or price structure
- Must appear at the top of an uptrend to be valid
Popular confirmation tools include:
- RSI (Relative Strength Index)
- Stochastic Oscillator
Final Thoughts on Dark Cloud Cover Trading Strategy
The Dark Cloud Cover pattern is a high-probability bearish signal when used correctly within the right market context.
At its core, this pattern tells a simple but powerful story:
Buyers attempt to push prices higher, but sellers step in and regain control shifting momentum to the downside.
When combined with:
- Resistance levels
- Market structure
- Technical indicators
…it becomes a reliable component of a professional trading strategy.
Continue Learning Candlestick Trading
The Dark Cloud Cover is just one of many bearish candlestick formations. To build a strong trading foundation, consider studying:
- Bearish Engulfing Pattern
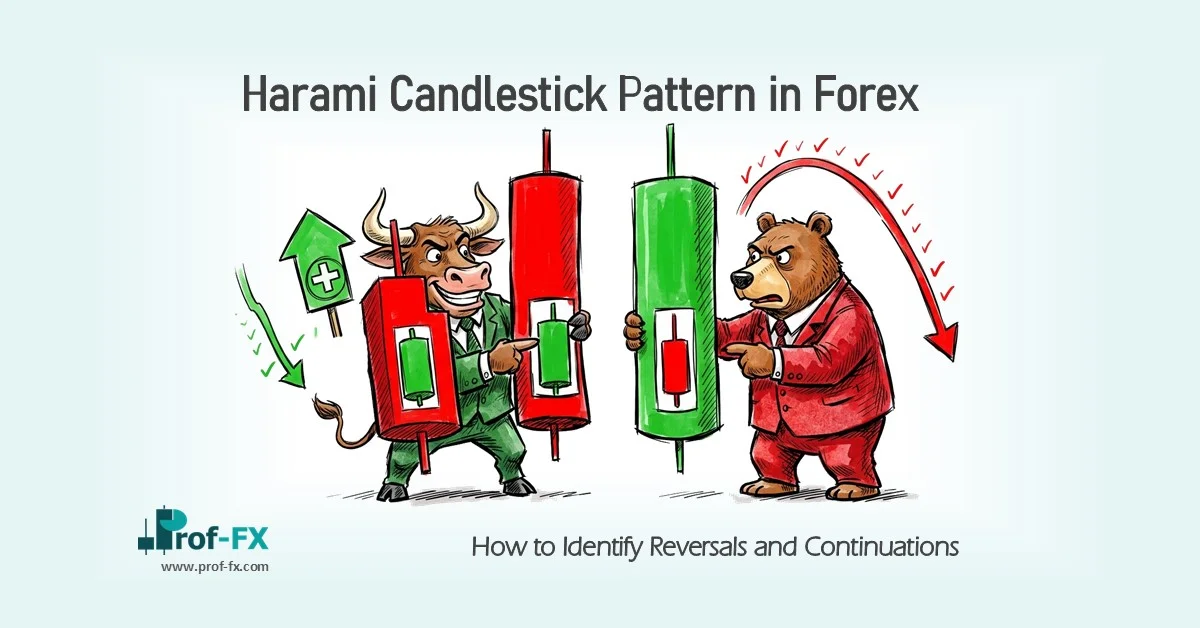
- Bearish Harami Pattern
- Evening Star Pattern
In addition, traders should understand the three core approaches to market analysis:
- Technical analysis
- Fundamental analysis
- Sentiment analysis
Mastery comes from combining these elements with discipline and consistent execution.