Bollinger bands are one of the most prominent indicators implemented by traders today. In this blog, we will first understand what Bollinger bands are and how to interpret them. This is followed by how they can be effectively incorporated as a confluence to any trading strategy.
IMPORTANT: This mini series of forex trading blogs are not considered advice on how you should trade, but merely is providing a tool you can use to compliment your existing forex trading strategy.
What are Bollinger Bands?
As the name itself elucidates, Bollinger bands refers to the price channels placed on a chart that constitutes a volatility range.
Bollinger bands are made of a set of three measures drawn in relation to price:
- 20 day period moving average in the middle which is the simple moving average
- An upper band of the standard deviation above the SMA
- A lower band of the standard deviation below the SMA
Bollinger bands use a statistical measure known as the standard deviation, to infer the potential support and resistance levels based on the volatility range of a certain pair/instrument. This is also most commonly referred to as the volatility channel.
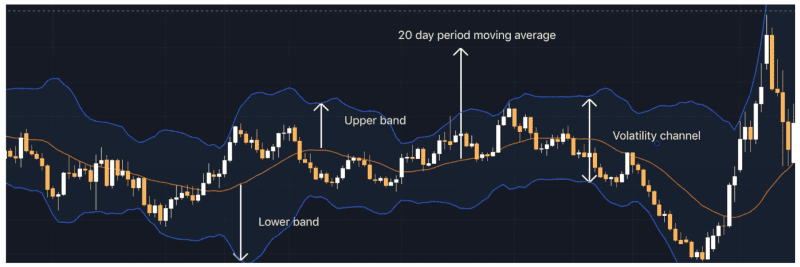
A volatility channel maps the lines above and below a 20 day period moving average. These lines expand or contract according to the market volatility. They will expand during high volatile periods and contract during low volatile periods.
Bollinger bands can help us to extract vital potential market movements such as:
- Trend continuation or a reversal
- Periods of consolidation (sideways movement)
- Potential entry or exit levels.
The Bollinger bands have a default setting of 20 day moving average with standard deviation of 2 (20,2). Having trade entries near the extreme bands of the volatility channel provides an element of confidence that there is resistance at the upper band or support at the lower band. So the general consensus is that when the price reaches the upper band, it is considered as overbought and when the price approaches the lower band, it is considered as oversold.
What does Standard deviation of Bollinger bands signify?
The standard deviation measures how much the price of any instrument/pair deviates from its mean value. Prices are distributed around the simple moving average (SMA).
The distribution of price within the bands in percentage is as follows:
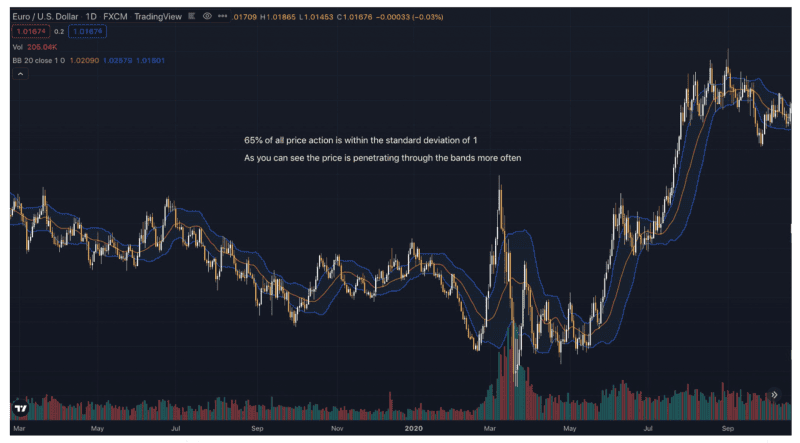
- Roughly 65% of price is within a standard deviation of 1
- Roughly 95% of the price is within standard deviation of 2
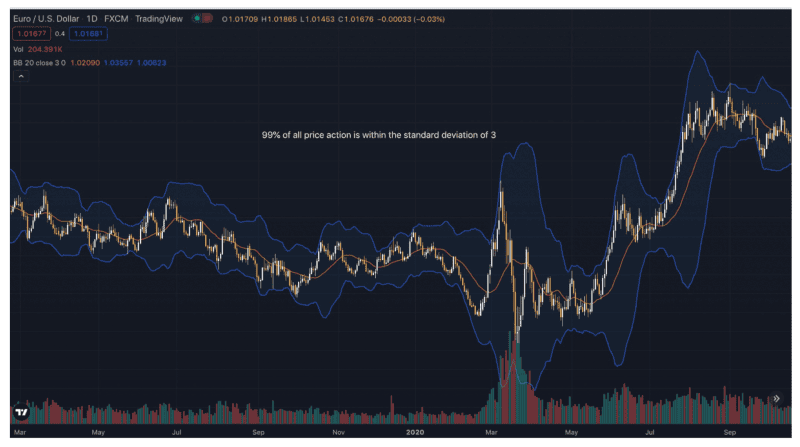
- Almost 99% of price is within standard deviation of 3
You can test it yourself to see what happens when you adjust the value of standard deviation. When you lower the value to 1, you will observe the price will go out of the bands very often. However, if you increase the value to 3, you will observe the price will leave the band rarely and might be better to find dynamic zones of support and resistance.
This is demonstrated in the charts below:
How to trade Bollinger bands?
How traders use Bollinger bands differs depending on their trading strategies. While using Bollinger bands, general consensus defines the lower and upper bands as price targets.
In a sideways market, the Bollinger bands provide potential support and resistance as it is most commonly seen that prices range within the Bollinger bands.
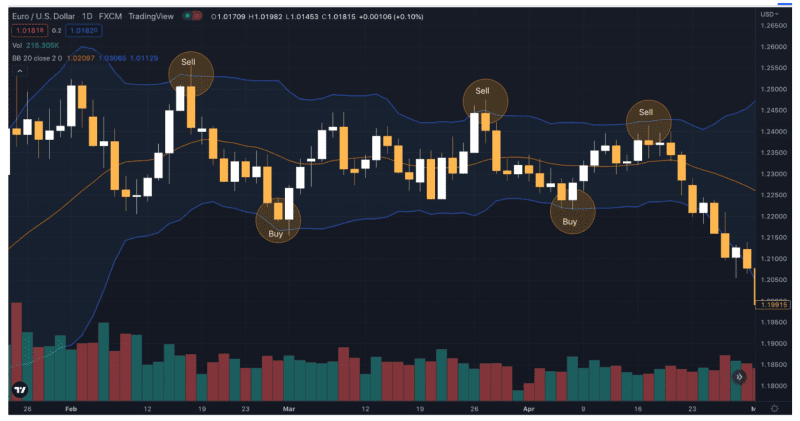
One of the most prevalent ways is to sell when prices approach the upper band and buy when prices approach the lower band. However, this should not be observed impulsively. This strategy works for consolidated ranges (sideways movement). As the bands become narrower, they imply the low volatile periods of the market where it is safe to observe this strategy. One of the examples of trading during ranges is demonstrated below.
What is more crucial is to use Bollinger bands when the market is trending. You could use the bands to enter a trend but only in the direction of the main trend. Just because the prices hit the upper or lower Bollinger does not necessarily mean that it is a good time to buy or sell. If the market is trending (whether in a downtrend or an uptrend) the prices will cross through the bands and that will not be an ideal time to enter the trades based on the bands (upper or lower).
Therefore, in an ideal setup, we look to sell at the upper band during downtrends (lower lows and lower highs) and we look to buy at the lower band in an uptrend (higher highs and higher lows). In other words, we look for pull backs or corrections in the direction of a trend.
An example of the use of Bollinger bands in trending markets is demonstrated below.
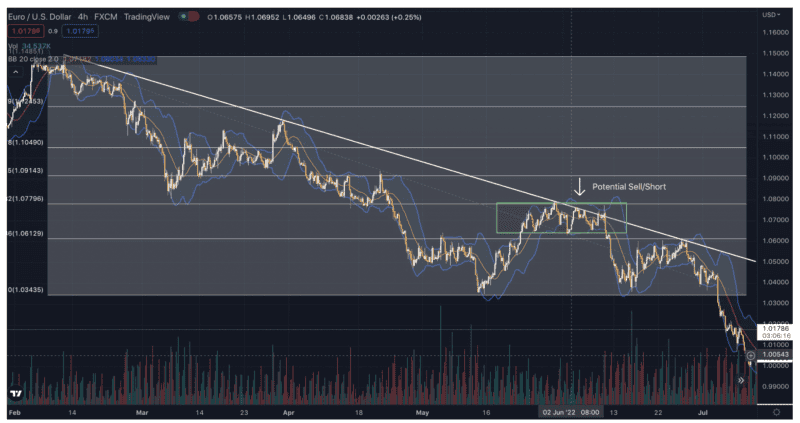
We have examined the chart of EURUSD on a 4 hourly time frame in the example above. Here, at first, we identified which trend the market is in. Once the downtrend is identified by the use of trend lines or market structures (lower lows and lower highs), we look for a sell entry at the upper band of Bollinger bands in order to ride the trend for continuation.
Traders can use many other confluences according to their strategy. However, incorporating Bollinger bands for entry is vital if the entry is in favor of the market trend. Likewise, it can be used to identify a buy entry at the lower band in an uptrend.
Lastly, any strategy a trader follows is not going to be consistently profitable until or unless all proper risk parameters are strictly observed. When you are trading at any prop firm or trading a live funded account, you should always practice good risk management. Have a stop loss, control your lot size and use what you feel comfortable trading.