Multi-time frame analysis (MTFA) is a structured approach that enables traders to evaluate market conditions across different time horizons. This methodology improves trade timing, enhances trend recognition, and helps identify when trends may be approaching exhaustion.
By analyzing the same currency pair across multiple time frames, traders gain a more comprehensive view of price action and can align short-term opportunities with the broader market context.
The Core Benefit of Multi-Time Frame Analysis
Multi-time frame analysis is built on a simple but critical principle: understanding the bigger picture before executing a trade.
Techniques such as trendlines, channels, and pitchforks (median lines) are commonly used to identify key support and resistance zones. When these tools are applied across multiple time frames, they provide deeper insight into market structure and potential reaction points.
This approach allows traders to:
- Align trades with the primary trend
- Identify high-probability entry points
- Improve timing of entries and exits
- Recognize potential trend exhaustion
In professional trading, this is often summarized as “seeing the forest through the trees.”
Practical Example: Multi-Time Frame Analysis on EUR/AUD
Step 1: Identify the Primary Trend (Higher Time Frame)
On the daily chart, EUR/AUD shows a clear downtrend originating from previous highs. A descending channel structure highlights key support levels, particularly around a significant low.
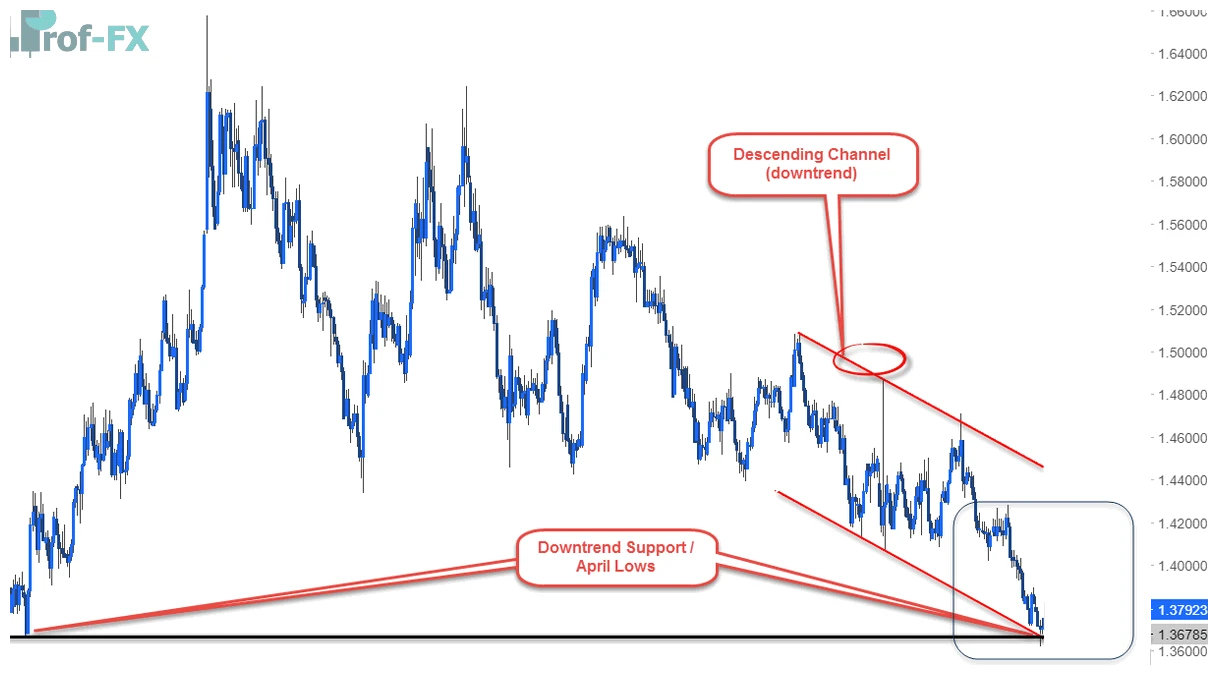
The confluence of:
- Trendlines
- Historical highs and lows
- Channel boundaries
creates a strong support zone. However, reaching support alone is not sufficient to justify a trade.
From an objective standpoint, price location does not confirm direction—price behavior does.
Step 2: Analyze the Lower Time Frame for Entry Signals
To refine the trade setup, the analysis shifts to a lower time frame, such as the 4-hour chart.
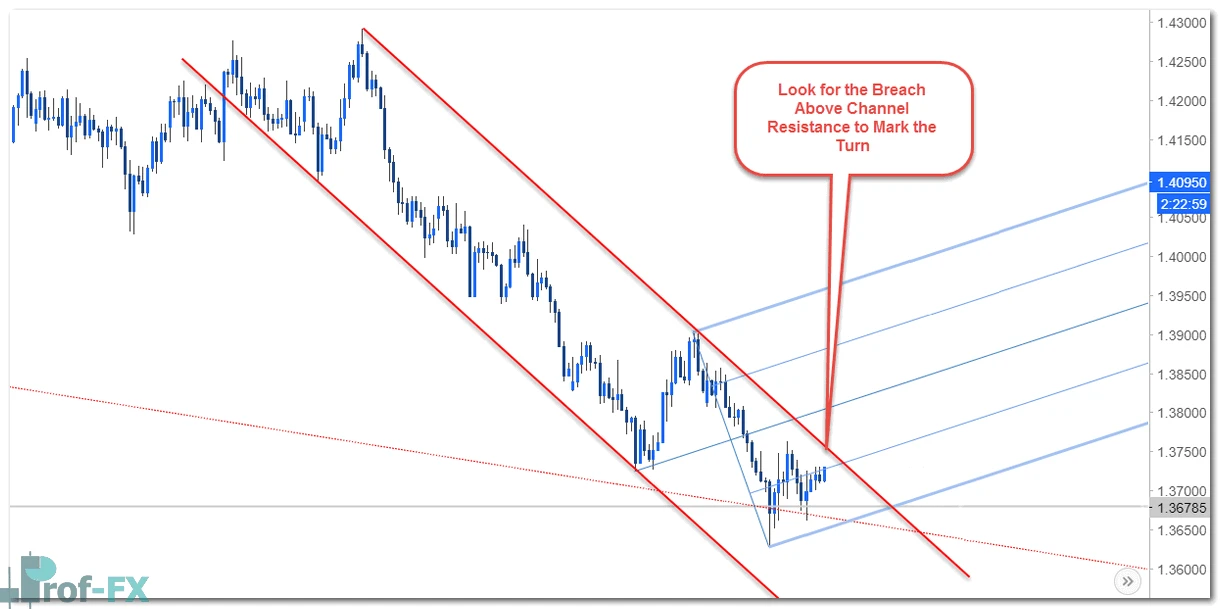
Within this time frame, a shorter-term descending channel becomes visible. This reflects continued bearish pressure in the near term, even though price is testing higher time frame support.
A critical development occurs when:
- Price breaks above the near-term channel resistance
This breakout signals a potential shift in short-term momentum and provides a trigger for a long (buy) entry, even within a broader downtrend.
Step 3: Define Targets Using Technical Structure
Once a valid entry signal is identified, traders can project potential targets using tools such as pitchfork (median line) analysis.
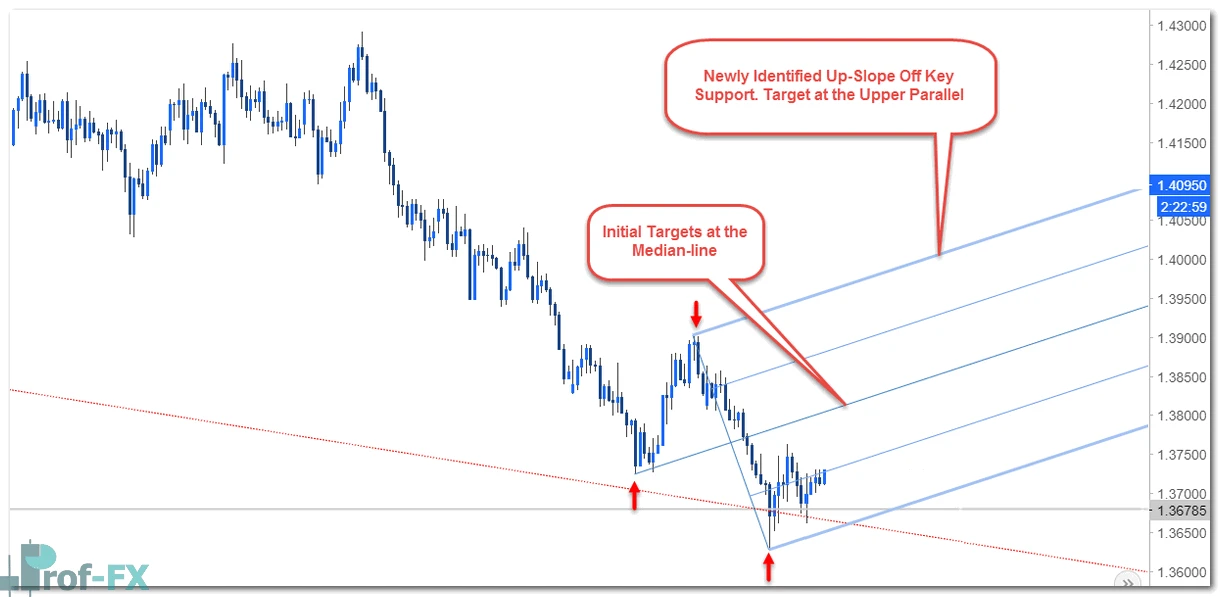
By drawing an ascending pitchfork from recent swing points (low–high–low), traders can:
- Identify the median line as an initial target
- Use upper median-line parallels as extended targets
As long as price remains above key structural levels, the bias shifts toward continued upside movement in the short term.
Step 4: Trade Development and Confirmation
Over time, the EUR/AUD pair:
- Broke above the short-term descending channel
- Retested the breakout level as support (confirmation)
- Continued upward toward the median line and beyond
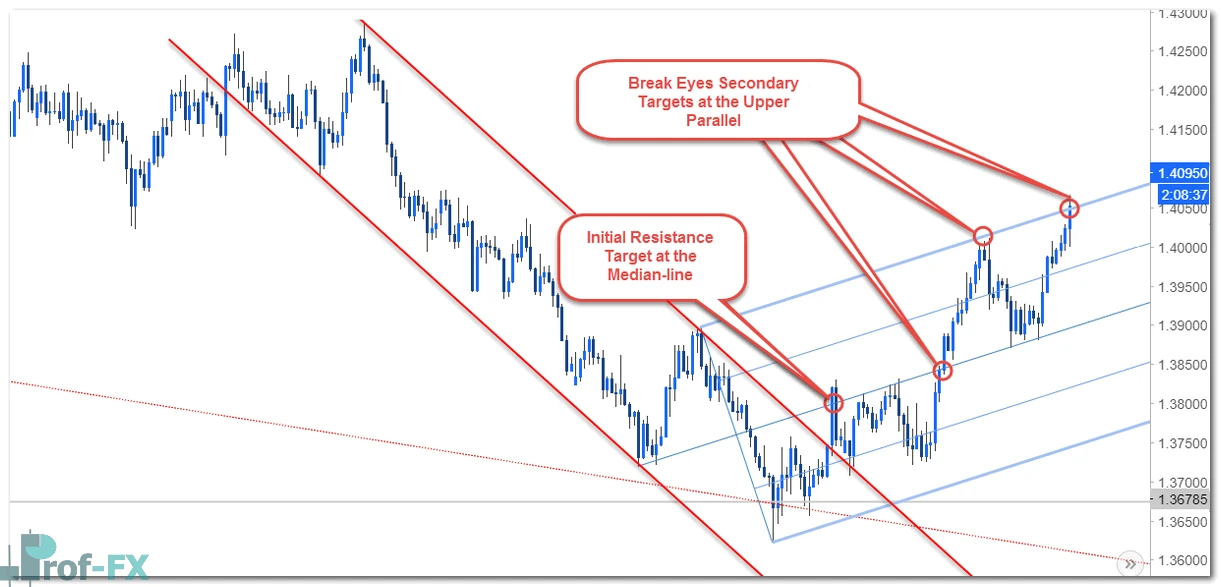
This sequence illustrates a key principle: lower time frame signals can provide actionable trade setups within the context of a higher time frame trend.
Understanding Primary vs Secondary Trends
Multi-time frame analysis distinguishes between:
- Primary trend: The dominant, long-term market direction
- Secondary (or tertiary) trends: Shorter-term movements within the primary trend
In many cases, short-term counter-trend opportunities arise within larger trends. These can be traded effectively, but they require stricter risk management.
Key Guidelines for Multi-Time Frame Analysis
1. Avoid Using Too Many Time Frames
Using excessive time frames leads to conflicting signals and analysis paralysis. Alignment across all time frames is rare and not required for successful trading.
2. Maintain a Logical Time Frame Ratio
A commonly used ratio is 1:4 to 1:6 between the entry (trigger) time frame and the trend time frame.
Examples:
- Trading on the 4-hour chart → use the daily chart for trend analysis
- Trading on the 1-hour chart → use the 4-hour chart for context
This ensures clarity and consistency in analysis.
3. Recognize Counter-Trend Trades
Short-term setups may go against the primary trend. These trades inherently carry higher risk.
Professional risk adjustments include:
- Lower leverage
- Smaller position size
- More conservative stop loss placement
Strategic
Multi-time frame analysis is not simply a technical technique—it is a decision-making framework. It ensures that trades are executed with both precision and context.
If traders rely solely on a single time frame:
- They may enter trades at poor locations
- Miss broader trend reversals
- Misinterpret short-term noise as meaningful signals
Conversely, integrating multiple time frames allows for:
- Better alignment with market structure
- More accurate entry timing
- Improved consistency in execution
Final Conclusion
Multi-time frame analysis provides a structured way to interpret price action across different horizons. It enables traders to balance context (trend) with timing (entry), which are two essential components of successful trading.
In professional forex trading, decisions are not made based on isolated signals. Instead, they are derived from a layered understanding of the market—where higher time frames define direction and lower time frames refine execution.
Traders who consistently apply this methodology gain a measurable edge, as they are able to operate within the broader trend while capitalizing on short-term opportunities with precision and discipline.