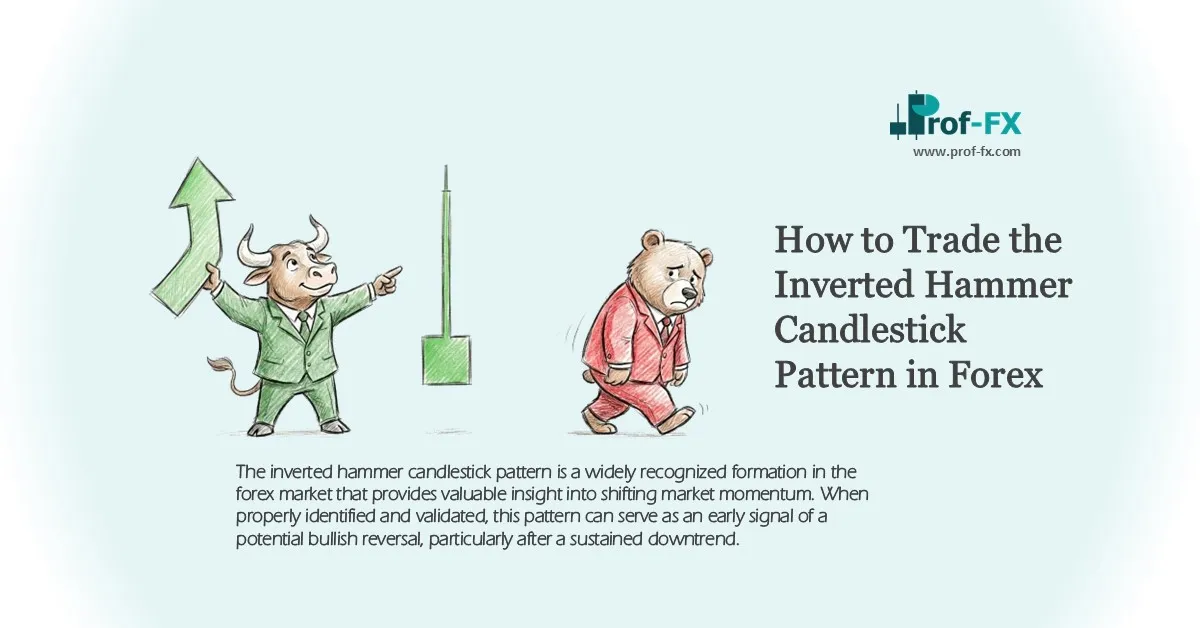
The inverted hammer candlestick pattern is a widely recognized formation in the forex market that provides valuable insight into shifting market momentum. When properly identified and validated, this pattern can serve as an early signal of a potential bullish reversal, particularly after a sustained downtrend.
Key Overview of the Inverted Hammer Pattern
This guide covers:
- The definition and structure of the inverted hammer
- Its advantages and limitations
- Practical applications within a trading strategy
- Supporting tools for confirmation and execution
What Is an Inverted Hammer Candlestick?
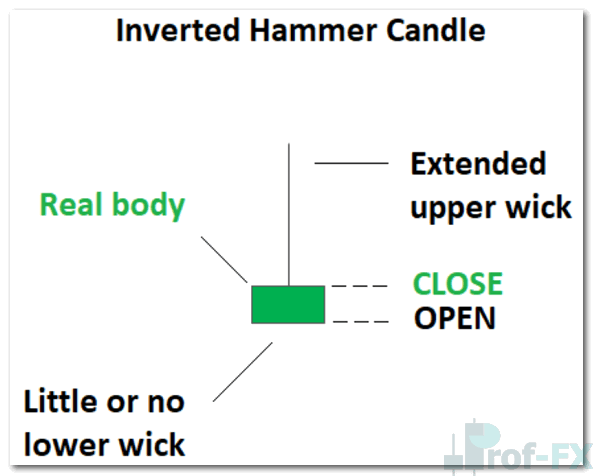
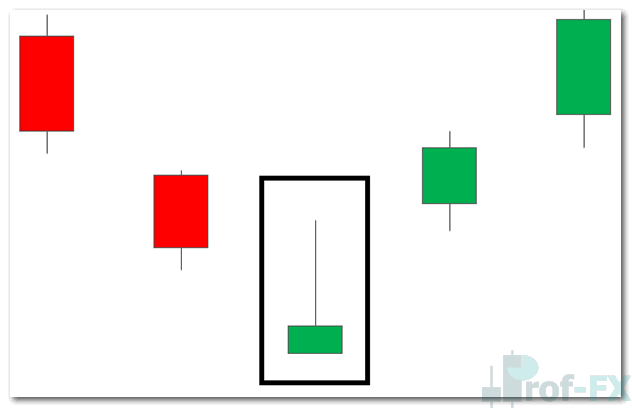
The inverted hammer is a single-candle formation characterized by:
- A small real body
- A long upper wick
- Little to no lower wick
It typically forms at the bottom of a downtrend and signals a potential shift in direction toward the upside. The long upper wick reflects an attempt by buyers (bulls) to push prices higher, even though sellers initially dominated the session.
However, this signal alone is not sufficient. Confirmation must come from subsequent price action, such as a bullish close in the following candle.
Inverted Hammer vs Shooting Star
The inverted hammer is often confused with the shooting star due to their similar appearance. However, their meanings are fundamentally different:
- Inverted Hammer → Bullish reversal signal at the bottom of a downtrend
- Shooting Star → Bearish reversal signal at the top of an uptrend
Correct contextual interpretation is critical. Misidentifying these patterns can lead to incorrect trade direction and unnecessary losses.
How to Identify an Inverted Hammer Pattern
To accurately identify the inverted hammer:
- Look for a candle with a small body and a long upper wick
- Ensure minimal or no lower wick is present
- Confirm that the pattern appears after a clear downtrend
- Give higher importance if it forms near a key support level
What Does the Inverted Hammer Indicate?
From a price action perspective, the inverted hammer signals:
- Potential bullish reversal
- Rejection of lower prices
- Early signs of weakening bearish momentum
When observed at strong support zones, the reliability of the signal improves significantly.
Advantages and Limitations of the Inverted Hammer
Advantages
- Early Entry Opportunities: Allows traders to participate near the beginning of a potential trend reversal
- Clarity: The structure is simple and easy to recognize, even for less experienced traders
Limitations
- Single-Candle Dependency: Relying solely on one candle without confirmation increases the risk of false signals
- Temporary Retracements: The pattern may only indicate a short-term pullback rather than a sustained reversal, especially in strong downtrends
From a professional standpoint, the inverted hammer should never be used in isolation. It must be integrated into a broader analytical framework.
How to Trade the Inverted Hammer Pattern
Effective trading of the inverted hammer requires combining candle recognition with contextual analysis, including trend direction and key price levels.
Trading Near Support Levels
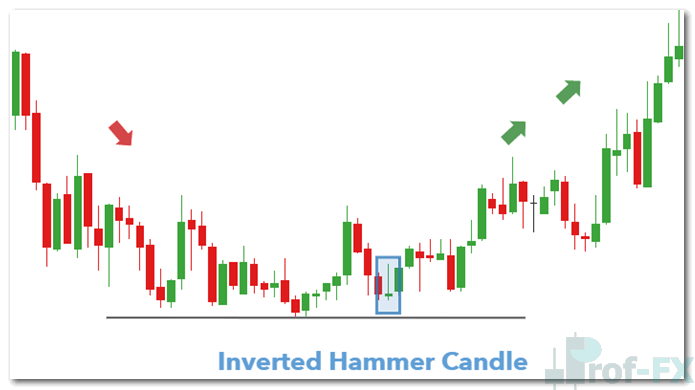
One of the highest-probability setups occurs when the inverted hammer forms near a support level.
In this scenario:
- The market is in a downtrend
- Price consolidates at support
- The inverted hammer appears, signaling potential bullish reversal
Trade execution principles:
- Entry: After confirmation (e.g., next bullish candle close)
- Stop Loss: Below the support level or candle low
- Take Profit: Near previous resistance levels or based on a favorable risk/reward ratio
Since trend reversals can develop into extended moves, traders may also use trailing stop-loss strategies or scale out at multiple target levels.
Combining the Inverted Hammer with Fibonacci Retracement
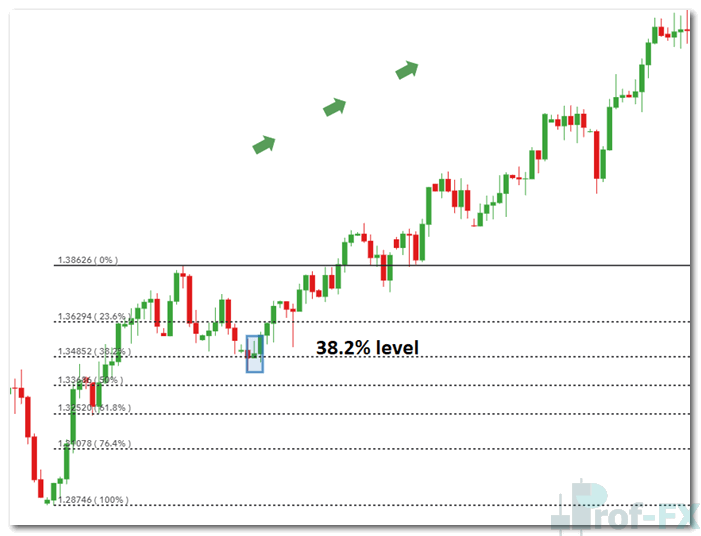
The inverted hammer becomes more powerful when aligned with key Fibonacci retracement levels.
For example:
- A downtrend retraces to the 38.2% Fibonacci level
- An inverted hammer forms at this level
- Price shows rejection of lower levels and resumes upward movement
This confluence strengthens the bullish case, as both price structure and technical levels support the same directional bias.
Professional traders consistently seek this type of multi-factor confirmation to improve trade probability.
Best Practices for Using the Inverted Hammer
To maximize effectiveness:
- Always confirm with additional indicators or price action
- Combine with support and resistance levels
- Align with broader market structure and trend context
- Maintain strict risk management using stop loss and position sizing
Expanding Your Candlestick Strategy
The inverted hammer is one of many valuable candlestick patterns. To build a robust trading system, traders should also understand:
- Bullish Morning Star
- Inverse Head and Shoulders
- Double Bottom formations
Additionally, mastering candlestick chart reading and overall price action is essential for consistent trading performance.
Final Perspective
The inverted hammer is a high-value signal when used correctly, but its effectiveness depends entirely on context and confirmation. It reflects a shift in short-term sentiment, not a guaranteed reversal.
Professional traders treat this pattern as a trigger within a structured system, not a standalone signal. When combined with support levels, Fibonacci retracement, and disciplined risk management, the inverted hammer can provide precise entry opportunities with favorable risk-to-reward profiles.
In forex trading, consistent results are achieved not by relying on single patterns, but by integrating them into a comprehensive, rule-based strategy.