In financial markets, some of the most meaningful signals emerge not from active movement, but from temporary inactivity. Periods of reduced volatility often precede expansion phases, and experienced traders recognize this cyclical behavior as a source of opportunity.
This concept is evident in volatility-based strategies, such as those involving the CBOE Volatility Index. When volatility spikes and later stabilizes, traders anticipate expansion cycles and position accordingly. A similar principle applies in price action through the use of inside bars, a formation that reflects temporary equilibrium before potential movement.
What Is an Inside Bar?
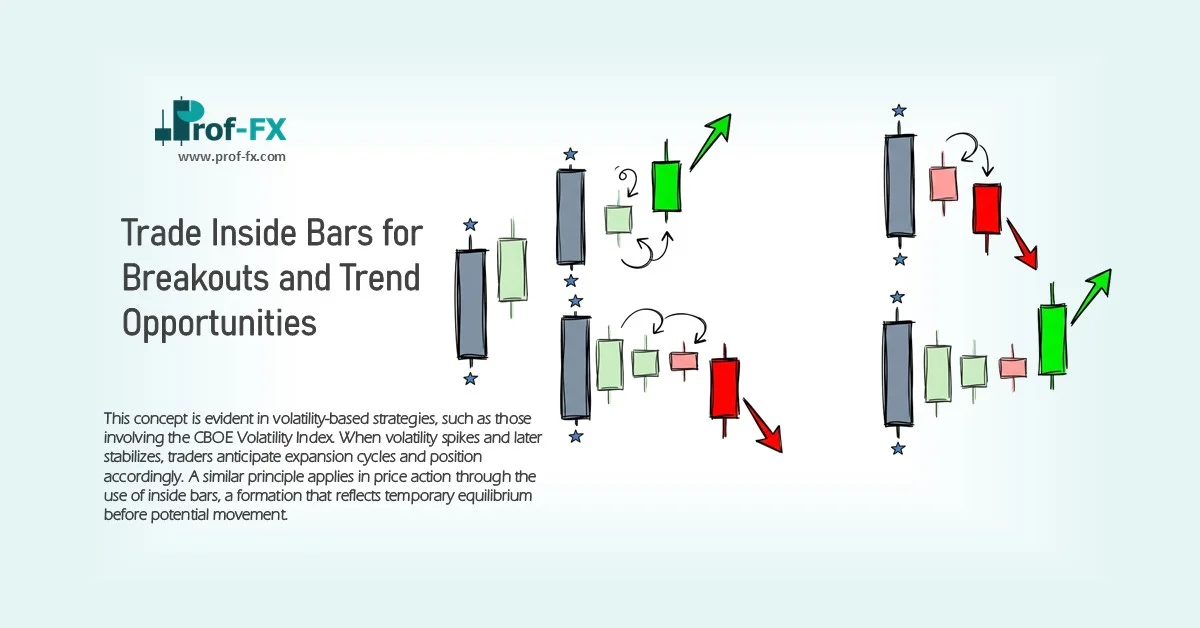
An inside bar is a candlestick pattern in which the entire range (high and low) of the current candle is contained within the range of the previous candle.
This structure represents a pause in market activity:
- Neither buyers nor sellers are in clear control
- Volatility contracts
- Price consolidates within a defined range
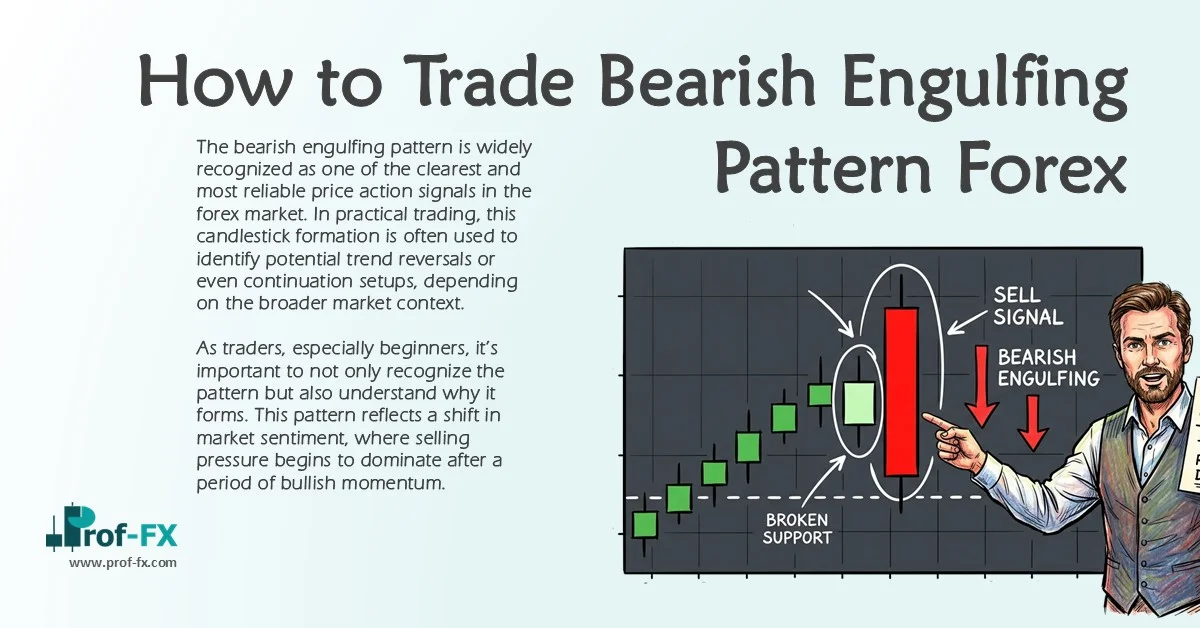
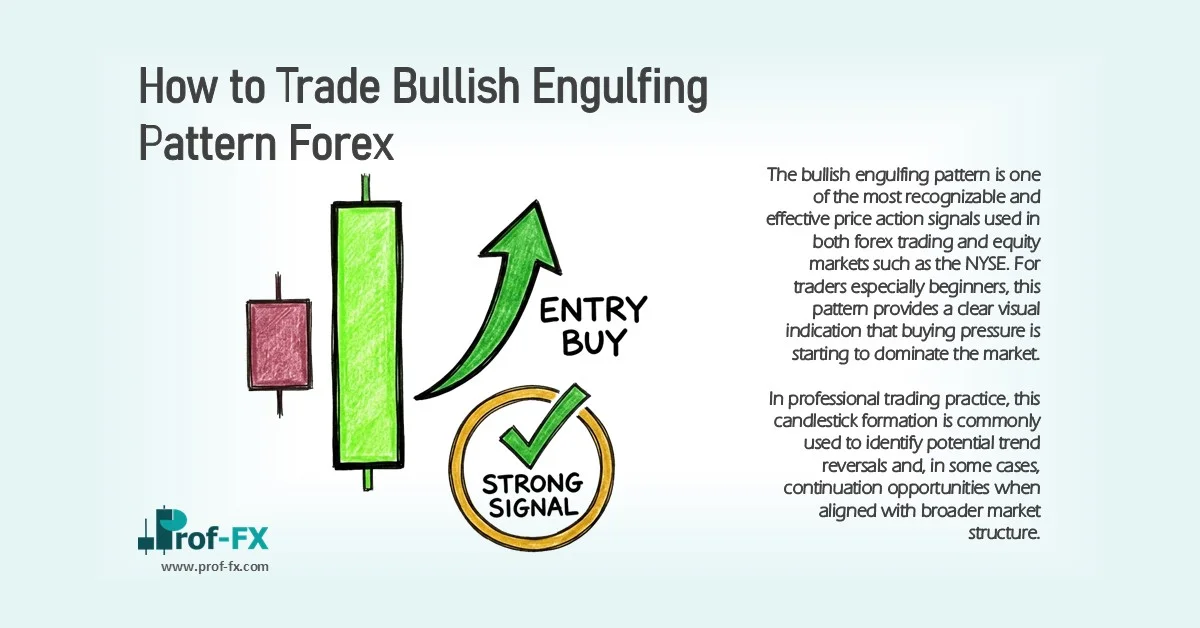
Unlike engulfing patterns, which signal expansion and momentum, inside bars reflect contraction and indecision. For a valid inside bar:
- The current candle must remain fully within the prior candle’s range
- No wick or body should exceed the previous high or low
This strict definition ensures that the pattern accurately reflects market balance.
GBP/JPY Daily Price Chart
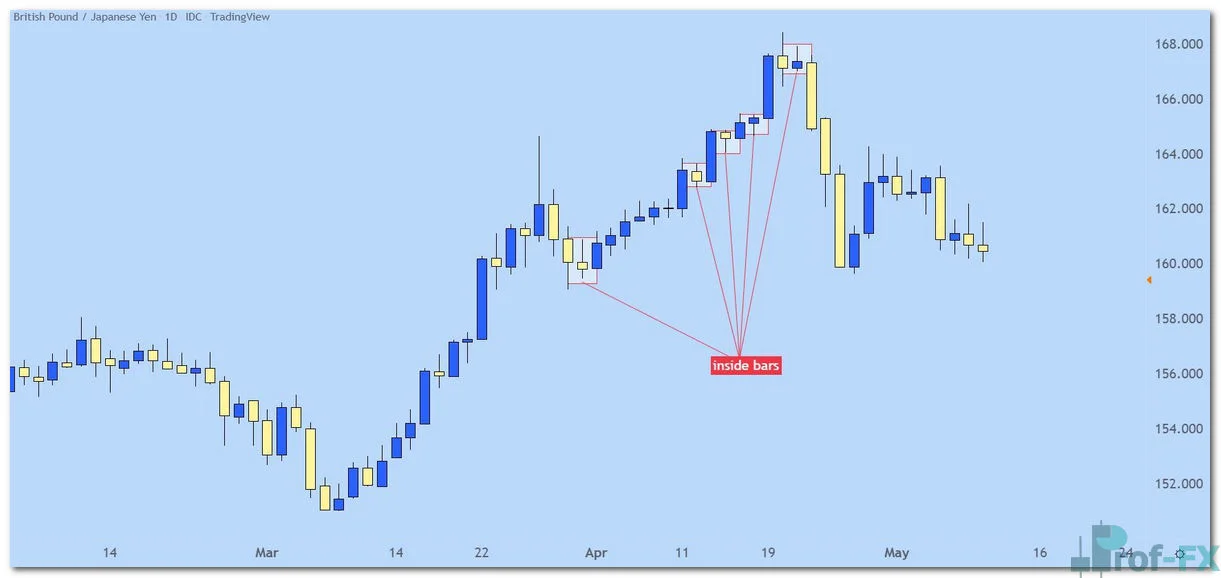
In the chart above, multiple inside bars are identified on the daily timeframe. Each instance shows price confined within the previous day’s range, forming what is often referred to as an “inside day.”
However, the real significance lies not in the formation itself but in what follows.
Interpreting Inside Bars in Market Context
Inside bars often appear during periods of uncertainty. This can occur around major events such as central bank decisions, economic releases, or other catalysts that cause both buyers and sellers to hesitate.
From a price action perspective, this hesitation represents:
- Market indecision
- Temporary balance between supply and demand
- A “compression” phase before expansion
While consecutive inside bars or choppy conditions may reduce clarity, a single inside bar especially after a directional move, can act as a precursor to a breakout.
The Breakout Potential of Inside Bars
The primary trading opportunity with inside bars comes from the expectation of volatility expansion.
A practical approach involves:
- Marking the high and low of the inside bar
- Waiting for price to break beyond either boundary
- Trading in the direction of the breakout
This breakout reflects a shift from equilibrium to directional intent.
In the earlier example, each inside bar was followed by a breakout that extended for at least one additional candle. While not all breakouts lead to sustained trends, the pattern consistently provides actionable signals.
Inside Bar Breakdown Example
To illustrate this more clearly, consider the final inside bar from the previous chart:
- High: 167.91
- Low: 166.99
Using a lower timeframe, we can observe how price reacted after the pattern formed.
GBP/JPY Two-Hour Price Chart
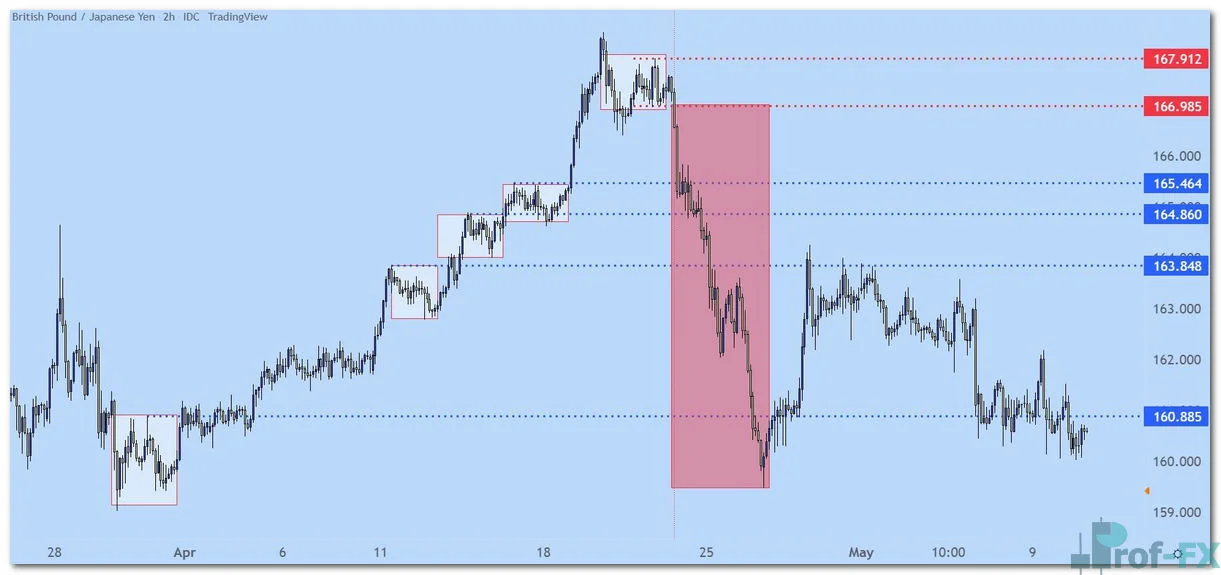
Shortly after the inside bar closed, sellers forced a breakdown below the low. This triggered a strong bearish move, resulting in a sustained downward trend.
This example highlights a key principle: inside bars often act as launch points for directional movement once the range is broken.
Not All Inside Bars Lead to Strong Trends
While inside bars frequently precede breakouts, not all result in strong or sustained trends. Some may lead to:
- Short-lived moves
- False breakouts
- Continued consolidation
In the chart above, several inside bars on the left side led to continuation within an existing bullish trend rather than initiating new trends. This reinforces the importance of context:
- Inside bars in trending markets often act as continuation signals
- Inside bars in ranging markets may produce less reliable outcomes
Best Practices for Trading Inside Bars
To improve reliability, traders should:
- Focus on higher timeframes (e.g., daily or 4-hour) to reduce noise
- Align setups with the broader trend direction
- Avoid overtrading in choppy or low-conviction environments
- Combine inside bars with support and resistance analysis
Key Takeaway
Inside bars represent periods of contraction in market volatility. While they may appear insignificant, they often precede meaningful price expansion.
From a professional standpoint, inside bars should be viewed as early-stage signals of potential breakout conditions, not standalone triggers. When combined with trend analysis and key levels, they provide a structured and objective framework for identifying high-probability trading opportunities.