


")
How the Guppy Indicator Reveals Market Momentum, Trend Strength, and Shifts in Trader Sentiment
Introduction — Why Trend Identification Matters for Every Forex Trader
Regardless of whether you are a short-term day trader or a long-term swing investor, trading in the direction of the prevailing trend is one of the most effective ways to improve consistency and reduce analytical uncertainty. For years, I personally struggled to define the broader trend objectively—until I was introduced to the Guppy Multiple Moving Average (GMMA), commonly known simply as the Guppy Indicator.
This indicator delivers a clear, mechanical way to understand market sentiment, identify trend direction, and time both entries and exits with higher confidence.
Meet the Guppy — A Simple, Objective Tool for Identifying Market Trends
Price action is one of the most popular methods for analyzing trends, but it carries a high degree of subjectivity. Traders interpret candlesticks differently, which often leads to inconsistent decisions. The Guppy solves this problem.
The GMMA groups exponential moving averages (EMAs) into two clusters:
- Short-term EMAs (green) → represents active traders and short-term sentiment
- Long-term EMAs (red) → represents investors and institutional positioning
This dual-layer structure visually reveals whether both groups agree on the direction of the market. When they move together, trend confidence increases—providing traders with a clear bias.
When you know the market’s general direction, the odds of successful trades rise significantly.
Using Guppy to Improve Trade Timing and Capture Market Turns
Beyond trend direction, one of the biggest challenges for traders is knowing when to enter and when to exit a position. The GMMA naturally highlights:
- Potential trend reversals
- Consolidation periods
- Shifts in market participation
- Early signs of momentum slowdown
While the Guppy can be used as a standalone trading system, I’ve found exceptional results when combining it with price action patterns and Heikin Ashi charts—a trio that filters noise, simplifies decision-making, and enhances trend-following performance.
The Origins of the Guppy Multiple Moving Average
The GMMA was first introduced by Daryl Guppy in his book “Trend Trading.”
Guppy designed the indicator to help traders visualize the relationship between short-term and long-term market participants.
The structure of the GMMA includes:
Short-Term EMAs (Trader Group)
Designed to capture fast-moving sentiment
Examples: 3, 5, 8, 10, 12, 15 EMAs
Long-Term EMAs (Investor Group)
Identifies the underlying, sustained trend
Examples: 30, 35, 40, 45, 50, 60 EMAs
In an ideal scenario:
- Traders hold positions in the direction of the long-term trend
- Short-term EMAs provide continuation or fresh breakout entry signals
- A crossover between the two clusters marks either a developing trend or a potential reversal
The GMMA makes these dynamics visually intuitive, even for beginner traders.
Reading Guppy Signals — Trend Strength, Support/Resistance, and Sentiment Shifts
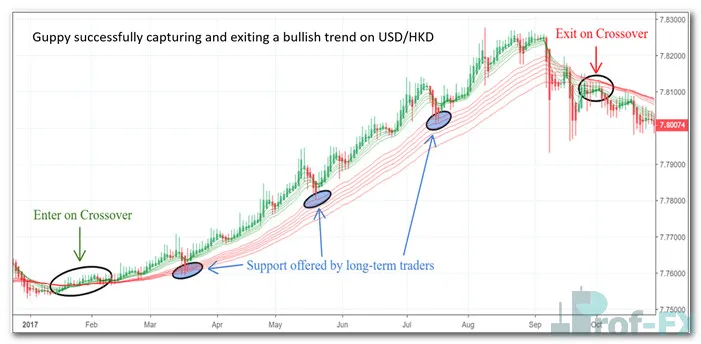
Example: GMMA Capturing a Bullish Trend on USD/HKD
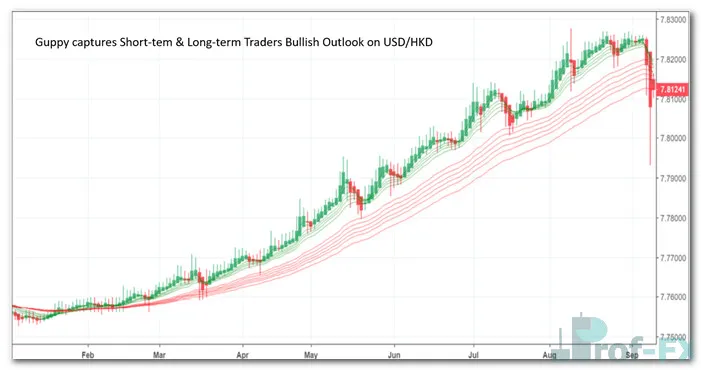
In the standard GMMA visualization:
- Green EMAs = short-term traders
- Red EMAs = long-term investors
When both clusters trend in the same direction, the indicator confirms trend strength and unified sentiment.
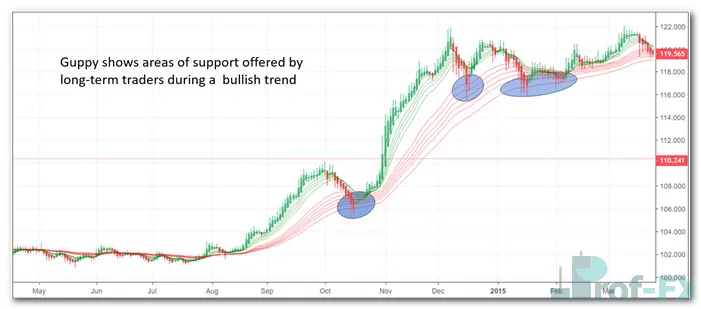
Moving Average Clusters as Dynamic Support and Resistance
The EMAs can function similarly to dynamic support or resistance.
For example:
- When price bounces off the long-term red EMAs during an uptrend, institutional traders are likely reinforcing their bullish outlook.
- If price remains above the green EMAs, short-term traders are aggressively supporting momentum.
Example: Long-Term Investors Supporting USD/JPY Trend
The distance between the green and red clusters is also critical:
- A large spread = strong trend with committed participation
- A narrowing spread = weakening momentum, potential consolidation, or trend exhaustion
The spacing within each cluster also matters.
If long-term EMAs begin to contract, it typically signals that the market is preparing for a reversal or a sideways range.
Guppy Crossovers — A Clear Signal of Trend Reversals
Just like standard moving averages, crossovers on the GMMA reveal shifts in market sentiment.
Bullish Crossover Example on USD/JPY
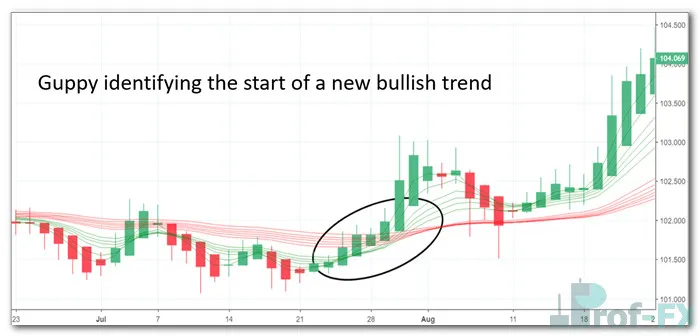
When the short-term green EMAs cross above the long-term red EMAs:
- Short-term traders are becoming increasingly optimistic
- A potential bullish trend is forming
- Momentum is transitioning from neutral to positive
The distance between the clusters post-crossover determines the strength and durability of the trend.
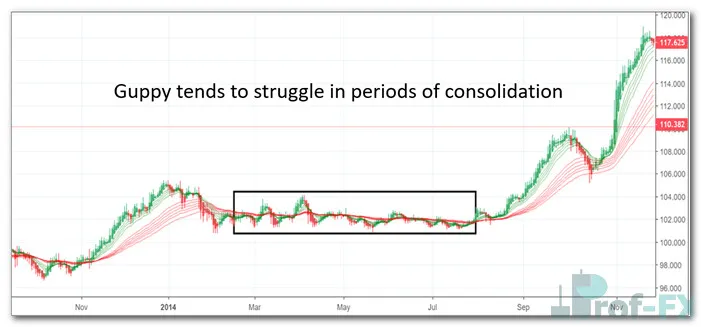
Understanding Guppy’s Weakness — Consolidating or Trendless Markets
The GMMA excels in trending environments but becomes less reliable in sideways markets.
This is due to the inherent lag in moving average calculations.
During consolidation:
- Both EMA clusters tighten
- Signals become less clear
- Momentum stalls
- False or premature reversals may appear
Example: GMMA Condensing During USD/JPY Consolidation
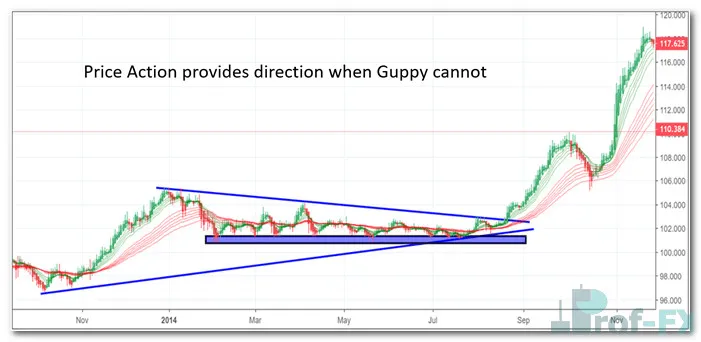
Combining Guppy With Price Action and Heikin Ashi for Optimal Results
Because price action involves pure price movement without lag, it compensates for GMMA’s weakness in consolidating markets.
Below is an example where:
- A Symmetrical Triangle provides breakout structure
- A support zone validates a key price level
- The GMMA confirms trend continuation after breakout
- Heikin Ashi candles smooth out noise for clearer trend visualization
This multi-layered approach strengthens decision-making by merging momentum, trend confirmation, and market structure.
Applying Guppy to Capture a Bullish Swing on USD/HKD
The combination of GMMA, price action, and Heikin Ashi charts helps traders:
- Identify early shifts in momentum
- Confirm actual trend strength
- Filter out market noise
- Enter trades with greater confidence
- Hold positions longer without emotional disruption
Final Thoughts — Why Every Trend Trader Should Know the Guppy Indicator
Despite its simplicity, the Guppy Multiple Moving Average provides powerful insights for trend traders.
While it is a complete system on its own, it becomes significantly more effective when used alongside:
- Price Action → helps navigate consolidations
- Heikin Ashi → removes candlestick noise
- Support and Resistance Analysis → clarifies levels of importance
Together, these tools allow traders to:
- Identify early trend shifts
- Confirm market momentum
- Capture and ride sustained bullish or bearish swings
- Avoid low-quality trades during consolidation
The GMMA is one of the most practical and visual ways to understand how different groups of market participants behave. When applied correctly, it helps Forex traders systematically identify and capture trending markets with clarity and confidence.


 Explained")

