


 Explained")
Oscillators are among the most widely used categories of technical indicators, and they are often introduced early in a trader’s learning process. However, this early exposure can sometimes lead to misunderstandings. While oscillators are indeed valuable, it is essential to recognize their true function: they are analytical tools designed to process historical price data in order to provide structured insights that support decision-making.
At their core, all technical indicators including oscillators are derived from past market behavior. Since historical data does not guarantee future outcomes, some traders prematurely conclude that an indicator “doesn’t work.” This interpretation is fundamentally flawed.
Indicators are not predictive mechanisms; rather, they are instruments that organize and present market data in a usable format. In the same way that a hammer does not drive a nail without proper use, an indicator does not generate results without informed application. When utilized correctly, indicators can significantly enhance a trader’s analytical framework and decision-making precision.
One of the most recognized oscillators is the Relative Strength Index (RSI), which shares several visual and functional similarities with the Commodity Channel Index (CCI). However, there are critical distinctions between the two. The CCI tends to exhibit higher volatility because it incorporates the full price range of candlesticks, including wicks (true range), whereas RSI is calculated solely based on closing prices. Furthermore, RSI is a bounded oscillator, constrained between 0 and 100, while CCI is unbounded, allowing it to move beyond fixed limits. This structural difference provides CCI with greater flexibility, particularly in identifying extended overbought or oversold conditions.
What is the Commodity Channel Index?
The Commodity Channel Index (CCI), developed by Donald Lambert, is an oscillator specifically designed to evaluate the strength of a trend. It achieves this by measuring the deviation between the current price and its historical average. Unlike many other oscillators, CCI is unbounded, meaning its values are not restricted within a fixed range and can expand significantly depending on market conditions.
A central component of the CCI is the zero-line, which serves as a baseline reference. When the indicator is positioned above zero, it indicates that the current price is trading above its historical average, suggesting bullish conditions. Conversely, when the CCI falls below zero, it reflects that prices are below the historical average, indicating bearish conditions. In addition, overbought and oversold levels are commonly marked at +100 and -100, respectively. These thresholds are not absolute and can be adjusted depending on the characteristics of the asset being analyzed. The following illustration provides a breakdown of how the CCI oscillator operates.
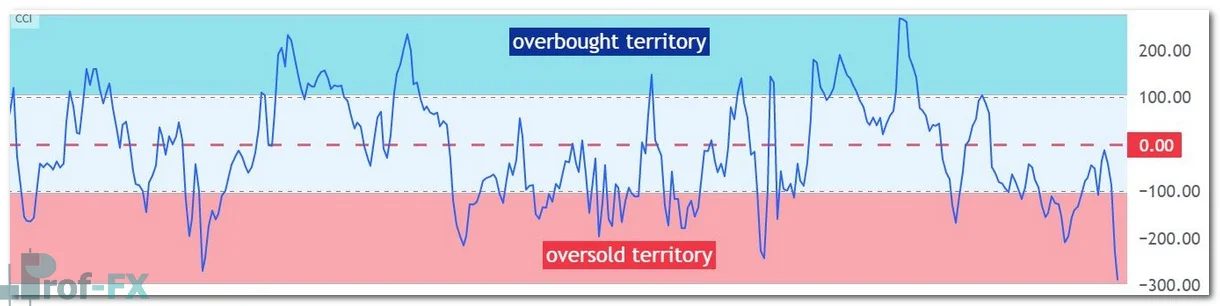
CCI Logic
A notable distinction between CCI and other oscillators, such as RSI, lies in how frequently it enters extreme zones. While RSI typically spends limited time in overbought or oversold territory, CCI often remains in these regions for extended periods. This behavior reflects its unbounded nature and sensitivity to price deviations.
More importantly, the interpretation of CCI differs from traditional oscillator approaches. Instead of treating overbought and oversold levels strictly as reversal signals, CCI is frequently used to identify trend continuation. Specifically, when the indicator rises above +100, it is commonly interpreted as a signal of strong bullish momentum, suggesting the potential for continued upward movement. Conversely, when the CCI drops below -100, it indicates increasing bearish pressure and may signal the continuation of a downward trend.
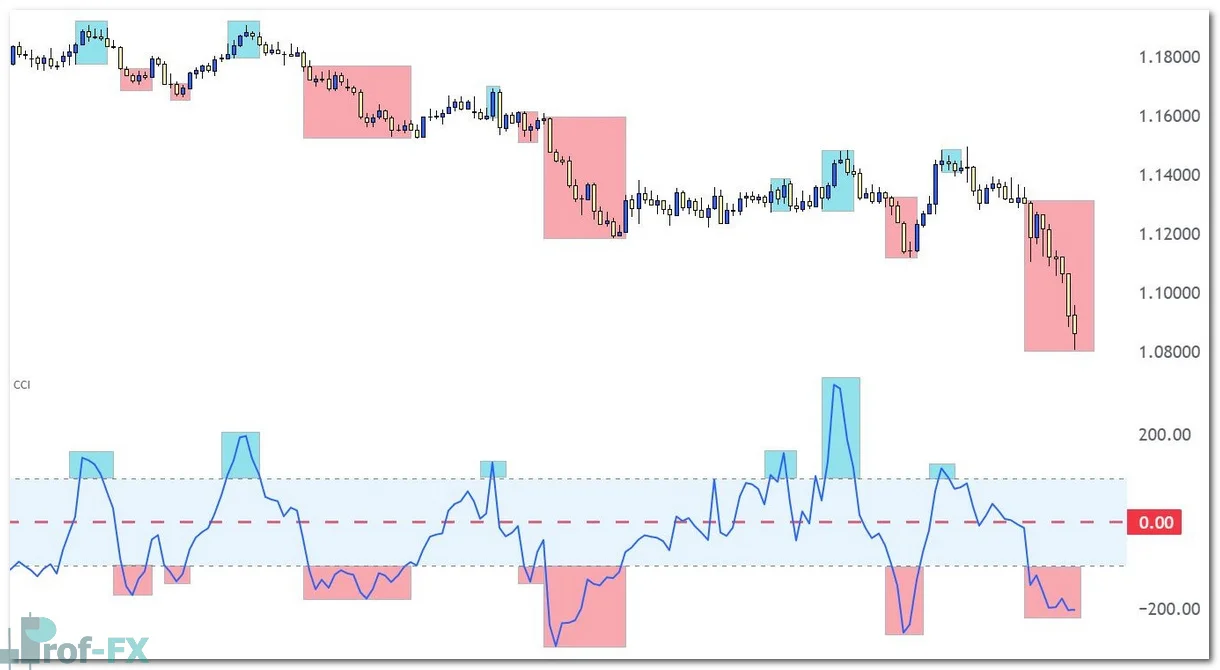
In the daily chart of EUR/USD below, each signal is identified based on this logic: bullish signals occur when the indicator crosses above +100, while bearish signals are generated when it moves below -100. As with all technical indicators and trading strategies, the effectiveness of these signals can vary. Some may align closely with sustained trends and produce favorable outcomes, while others may result in less optimal performance. This variability underscores the importance of integrating CCI within a broader trading strategy rather than relying on it in isolation. Nevertheless, understanding this foundational logic represents a critical step for traders aiming to incorporate CCI effectively into their analysis.
EUR/USD Daily Price Chart


