


Like many professional disciplines, forex trading involves a wide range of technical terminology that can be difficult for beginners to fully understand. Among the most commonly used concepts are overbought and oversold conditions. This article explains what these terms mean in the context of currency pair price action and outlines the potential trading opportunities that may emerge when these market conditions occur.
Overbought vs Oversold: Key Trading Insights
- Overbought refers to an extended price movement to the upside
- Oversold refers to an extended price movement to the downside
- When price reaches extreme levels, a potential reversal may occur
- The Relative Strength Index (RSI) can help confirm reversal signals
OVERBOUGHT VS OVERSOLD
These two terms are relatively self-explanatory and accurately describe market conditions based on price movement.
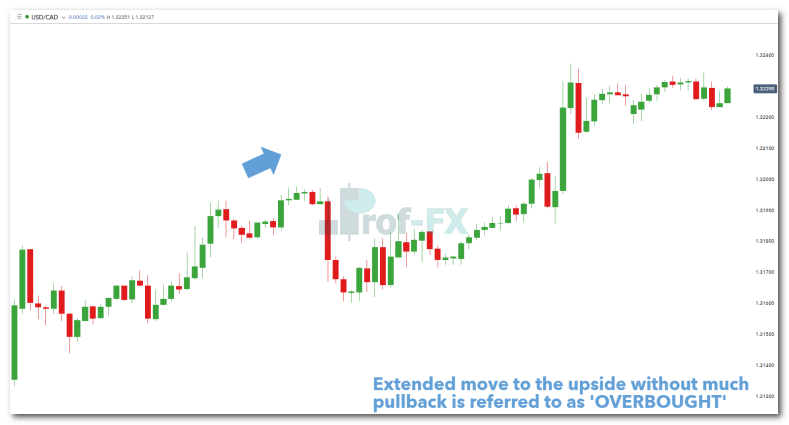
An overbought condition refers to a period during which price has experienced a strong, sustained upward move over a certain timeframe with minimal pullback. In chart terms, this is typically represented by a price movement progressing from the lower-left toward the upper-right, similar to the chart example below.
USD/CAD HOURLY CHART (OVERBOUGHT)
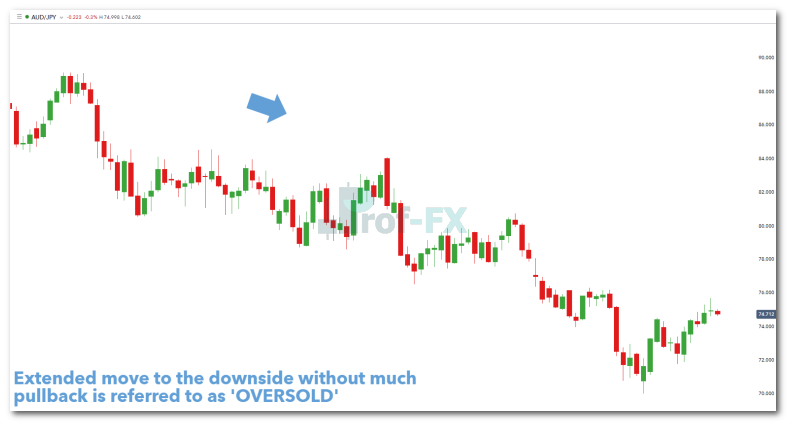
By contrast, an oversold condition describes a period in which price has declined significantly and consistently over a specified timeframe, again with limited corrective movement. In practical terms, this is a move from the upper-left toward the lower-right, as illustrated in the chart below.
AUD/JPY WEEKLY CHART – OVERSOLD
Because price cannot continue moving in one direction indefinitely, every trend will eventually reach a point of exhaustion and reverse or consolidate. Currency pairs that enter overbought or oversold territory often present a higher probability of reversal, although it is essential to recognize that price may remain in these extreme conditions for an extended period.
For this reason, experienced traders do not rely solely on price movement. Instead, they use oscillators and momentum indicators to assess whether a reversal is genuinely developing.
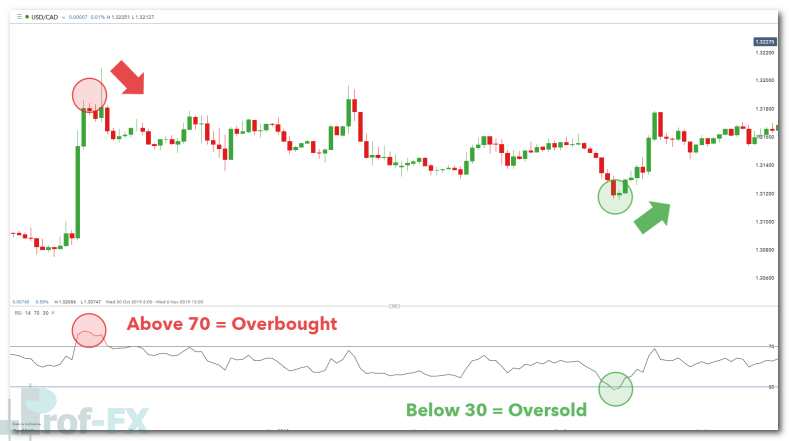
OVERBOUGHT OVERSOLD INDICATOR READINGS WITH RSI
One of the most widely used tools for identifying overbought and oversold conditions is the Relative Strength Index (RSI).
The concept is straightforward:
- When the RSI rises above 70, the market is considered overbought, which may signal the possibility of a downward correction or reversal
- When the RSI falls below 30, the market is considered oversold, which may indicate the potential for an upward move
This indicator is highly regarded because it helps traders objectively measure momentum rather than relying on subjective chart interpretation alone.
RSI OVERBOUGHT AND OVERSOLD LEVELS
However, we must remain patient when using RSI-based signals. In many market conditions, the RSI can remain in overbought or oversold territory for a prolonged period, as shown in the chart below.
A common mistake among less experienced traders is attempting to identify the exact top or bottom of a strong trending move, only to find that price continues extending further into extreme territory.
The more professional approach is to wait until the RSI crosses back below 70 after an overbought reading, or moves back above 30 after an oversold reading, before considering an entry.
RSI PROLONGED OVERBOUGHT AND OVERSOLD SIGNALS
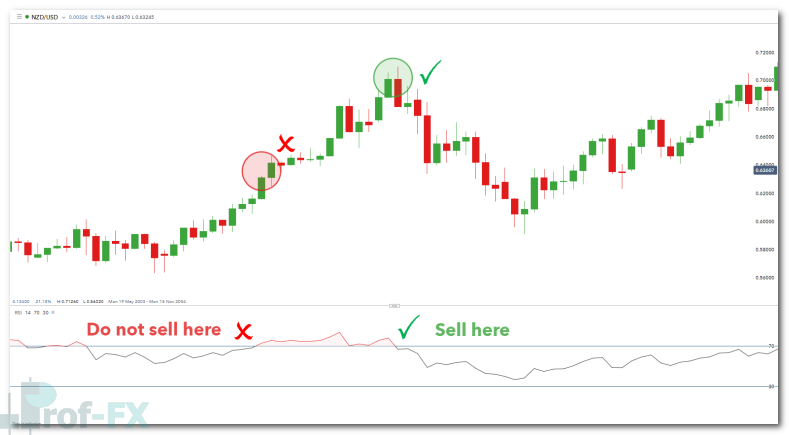
As shown in the image above, the RSI clearly breaks above the 70 threshold, generating an overbought signal. However, a seasoned trader would not immediately initiate a short position, because there is still uncertainty regarding how far the bullish momentum may continue.
The more statistically sound approach is to wait until the RSI falls back below 70, and only then consider entering a short trade. This method generally provides a better entry point and a higher-probability setup.
The same principle applies when the RSI drops below 30. Rather than entering immediately, traders should ideally wait for confirmation through a move back above the 30 level before initiating a long trade.
This disciplined approach significantly improves trade quality and reduces the risk of entering prematurely.
FREQUENTLY ASKED QUESTIONS (FAQs)
How reliable are overbought and oversold signals?
As standalone signals, overbought and oversold conditions are not fully reliable.
A useful analogy is building a house. A builder may depend heavily on a hammer, but a hammer alone is not enough to complete the entire structure. Other tools such as a saw, drill, and measuring instruments are equally necessary.
The same principle applies in forex trading.
Overbought and oversold signals should be treated as one component of a broader trading framework, rather than a complete trading system by themselves.
To improve reliability, traders should combine these signals with additional tools such as:
- trend identification
- risk management
- market sentiment
- support and resistance
- price action confirmation
This multi-layered approach allows traders to make more objective and higher-conviction trading decisions.
What can traders do to strengthen overbought and oversold signals?
There are several proven tools and methods that can strengthen the validity of overbought and oversold signals.
Below are some of the most effective approaches:
- Identify the trend – Trend filtering helps traders align entries with broader market direction. For example, during a strong bullish trend, traders often focus on oversold signals as long-entry opportunities, as these align with the dominant direction. The reverse applies in a bearish trend, where overbought signals may be used for short entries.
- Risk management – Proper application of risk-reward ratios, along with well-defined stop loss and take profit (limit) levels, is essential. No signal should be traded without a clearly structured risk management plan.
- Sentiment – Using client sentiment data or broader market positioning can further validate whether an overbought or oversold signal is likely to lead to a reversal.
From a professional trading perspective, confirmation across multiple tools is what transforms a basic signal into a high-quality trade setup.
BECOME A BETTER TRADER WITH THESE TRADING INSIGHTS
Another highly effective indicator for evaluating momentum and trend strength is the stochastic oscillator, which is frequently used alongside RSI for confirmation.
If you are new to forex trading, exploring structured forex trading courses for beginners can significantly accelerate your understanding of concepts such as momentum, reversal signals, risk management, leverage, and trend analysis.
A disciplined trader does not trade signals in isolation. The most consistent results come from combining technical indicators, market context, and strict execution rules.


