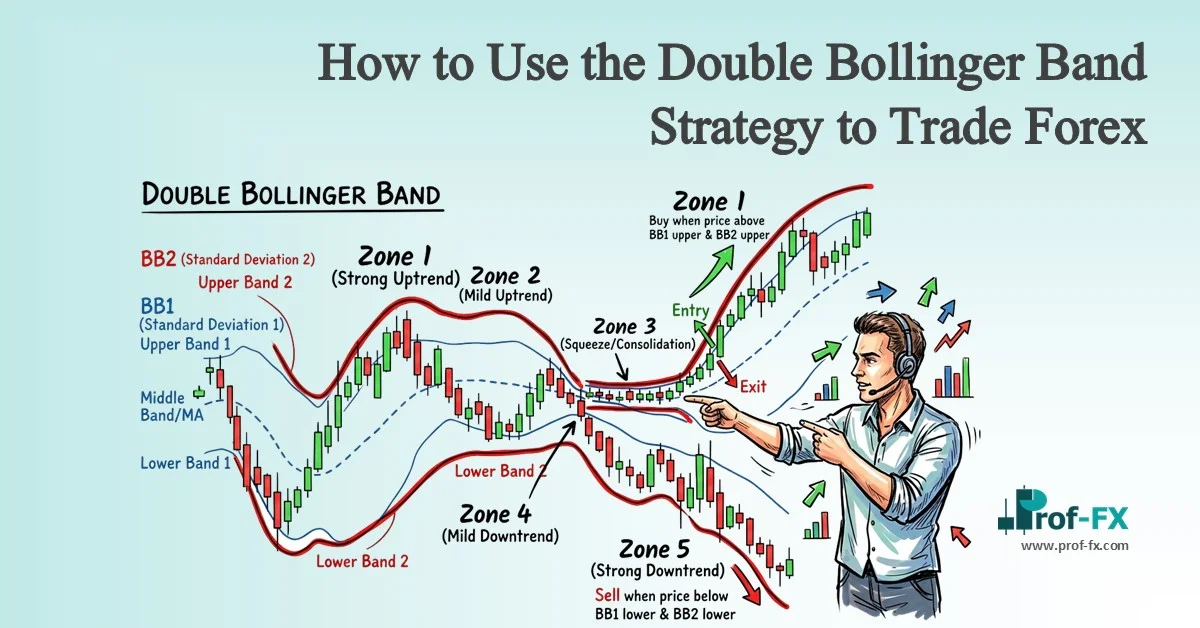
The Double Bollinger Band® strategy is widely recognized as one of the most effective technical approaches for evaluating price momentum and market volatility in forex trading. Its primary strength lies in helping traders identify high-probability entry and exit points, while also determining whether an existing trend is sustaining strength or beginning to lose momentum.
This strategy is particularly valuable for traders who want a more structured framework for analyzing trend continuation, breakout opportunities, and volatility shifts.
In this guide, you will learn:
- What the Double Bollinger Band® strategy is
- How to trade forex using Double Bollinger Bands®
- The advantages and limitations of this strategy
- Additional insights into Bollinger Bands® applications
This article assumes you already have a basic understanding of Bollinger Bands and their role in forex technical analysis.
What Is the Double Bollinger Band Strategy?
The Double Bollinger Band (DBB) strategy uses two separate Bollinger Bands settings to create a more refined framework for filtering trade entries and exits in the forex market.
The objective is straightforward:
- Enter long positions when price breaks above the one standard deviation band
- Enter short positions when price breaks below the one standard deviation band
This method can be applied across several market conditions, including:
- ranging markets
- breakout setups
- trend momentum analysis
- trend slowdown detection
To apply the strategy, add the following indicators to your preferred currency pair or trading instrument:
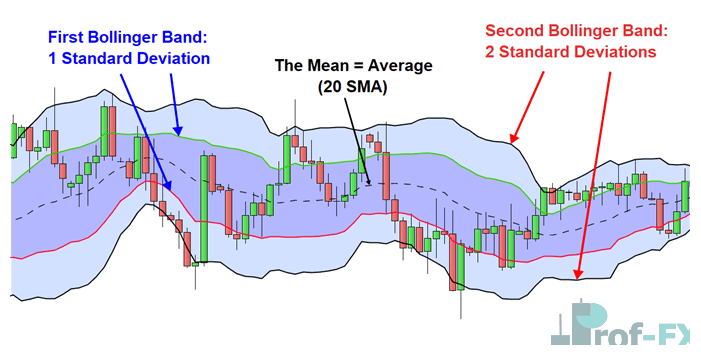
- Default Bollinger Band® (20, 2)
- 20-period Simple Moving Average (SMA)
- 2 standard deviations from the mean
- Second Bollinger Band® (20, 1)
- Same 20-period SMA
- 1 standard deviation only
Before implementing the strategy, it is essential to understand how the chart structure is interpreted.
The center dotted line represents the 20-period moving average.
Moving outward from the center:
- the green and red lines represent the single standard deviation
- the outer black lines represent the double standard deviation
This layered structure provides a clearer view of market strength, directional bias, and volatility expansion.
From a statistical perspective, approximately 95% of price candles are expected to remain within the two standard deviation bands. As a result, price movement through the different zones generates multiple actionable trading signals.
The Three Double Bollinger Band Zones
The DBB strategy is built around three core trading zones, each serving a distinct analytical purpose.
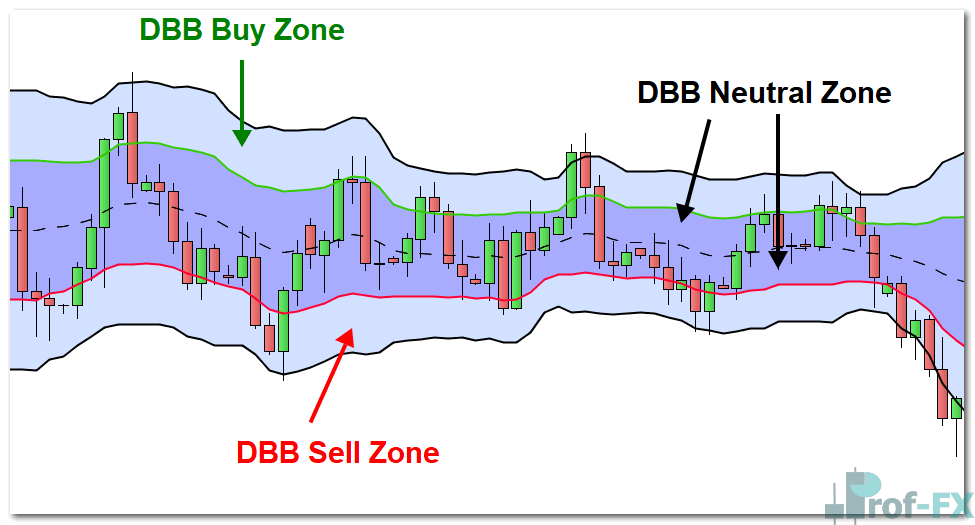
1. DBB Buy Zone
This is the light blue area above the 20 SMA, positioned between:
- the first standard deviation
- the second standard deviation
When price enters this zone, it signals bullish momentum and presents a buy opportunity.
2. DBB Neutral Zone
This is the purple area between the upper and lower single standard deviation bands.
Price action inside this zone often indicates:
- lack of directional conviction
- reduced momentum
- sideways or choppy market conditions
For trend-following traders, this zone generally suggests avoiding new entries until a clear directional breakout occurs.
3. DBB Sell Zone
This is the light blue area below the 20 SMA, located between:
- the lower first standard deviation
- the lower second standard deviation
Price movement into this zone signals bearish momentum and provides a sell signal.
All three zones are illustrated below:
The strength of this framework lies in its ability to objectively classify market conditions into bullish, neutral, and bearish states.
How to Trade Forex with Double Bollinger Bands
The Double Bollinger Band strategy is most commonly applied through two core approaches:
- breakout trading
- trend trading
Both methods offer highly practical use cases in forex markets.
Double Bollinger Band Breakout Strategy
The breakout approach is designed to capture price movements that break beyond an established range with convincing momentum.
The key requirement is that price must:
- break above or below the range
- simultaneously move decisively into either the DBB buy zone or DBB sell zone
This added confirmation helps reduce exposure to false breakouts, which are common in forex trading.
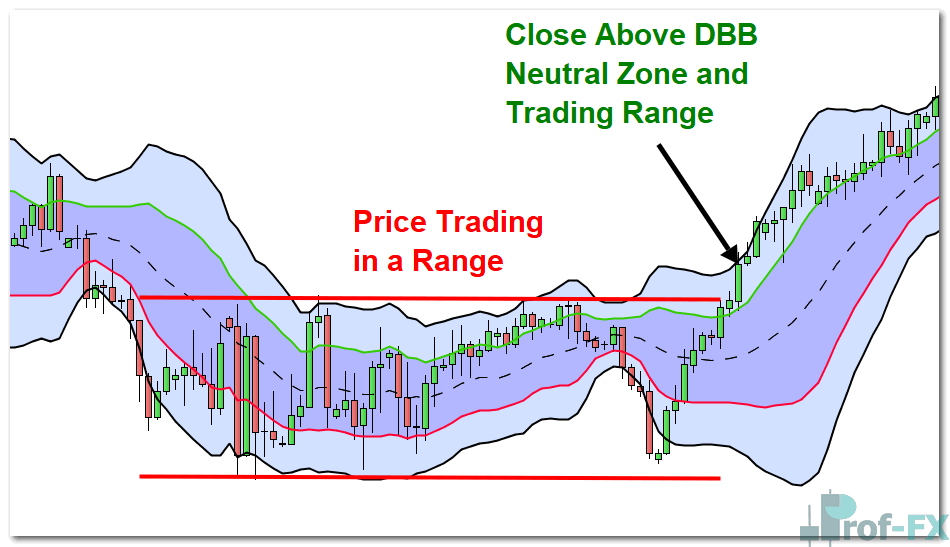
For example, in an EUR/GBP range breakout scenario, price may initially move above the upper band of the single standard deviation (green line), yet still remain trapped within the broader range.
This alone is not sufficient confirmation.
A stronger signal occurs only when price:
- breaks the range structure
- closes firmly inside the DBB buy zone
- shows clear bullish momentum
An additional layer of confirmation comes from observing Bollinger Band expansion.
When a breakout occurs after a period of contracting bands and low volatility, it often signals the start of a larger directional move.
A large bullish candle breaking into the buy zone provides a high-confidence long setup.
For risk management:
- place stop loss near the 20 SMA
- set take profit at key resistance levels
- maintain a favorable risk-to-reward ratio
This disciplined structure significantly improves trade quality.
Double Bollinger Band Trend Trading Strategy
The trend trading approach focuses on evaluating the strength and sustainability of an existing trend.
This strategy helps traders:
- stay in strong trends longer
- add to winning positions
- exit when momentum weakens
Continuing with the EUR/GBP example after the breakout, once price begins trending upward, candles may break above:
- the upper one standard deviation band
- even the outer two standard deviation band
This behavior reflects strong bullish momentum and elevated volatility.
When price consistently trades within the DBB buy zone, it confirms that buyers remain in control.
Under these conditions, the indicator becomes an effective trend-tracking tool.
As long as price remains:
- inside the buy zone
- above the 20 SMA midline
the long bias remains valid.
Exit strategies can be based on individual risk tolerance.
More conservative traders may exit when price closes below the 20 SMA.
More aggressive traders may wait for price to move through the neutral zone and into the DBB sell zone.
For dynamic trade management, the 20 SMA can be used as a trailing stop loss reference, allowing stops to move upward as the trend advances.
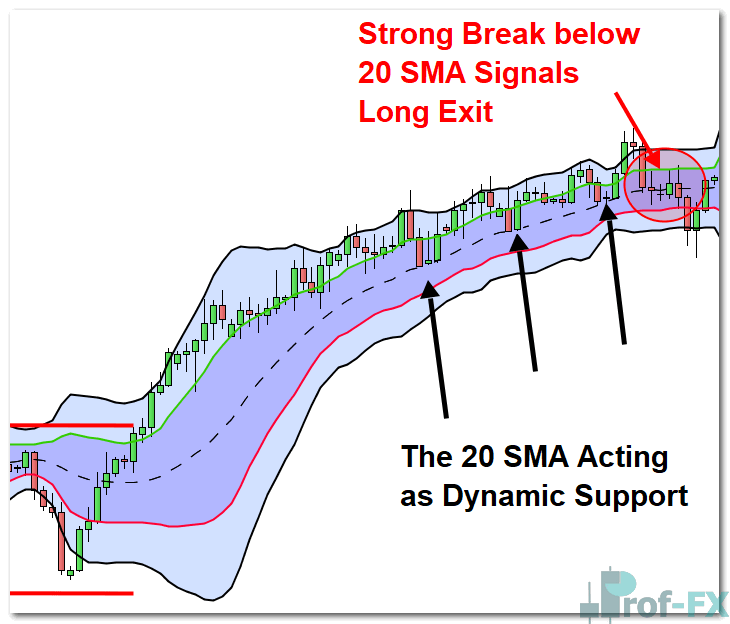
This makes the DBB strategy highly effective for trend-following and position scaling.
Advantages and Limitations of the Double Bollinger Band Strategy
No trading strategy performs flawlessly under all market conditions. Therefore, understanding both strengths and weaknesses is essential.
Advantages
- Low volatility often precedes significant price expansion, making the DBB useful for spotting upcoming moves
- Provides clear and objective entry and exit signals
- Excellent for identifying trend momentum and volatility strength
- Works well in both breakout and trending markets
Limitations
- Sharp moves into buy or sell zones can still reverse unexpectedly
- False signals may occur during erratic market conditions
- Requires strict risk management, stop loss discipline, and position sizing
The most important conclusion is clear: the strategy is highly effective only when combined with proper risk control.
Without disciplined execution, even strong technical signals can fail.
Further Reading on Bollinger Bands
Bollinger Bands® remain one of the most trusted indicators for measuring market volatility and price behavior.
They provide traders with a clear visual framework for understanding:
- volatility expansion and contraction
- momentum strength
- trend continuation
- potential reversals
Many professional traders also combine Bollinger Bands® with other indicators such as MACD, support and resistance, and price action confirmation to improve accuracy.
At a professional level, the Double Bollinger Band® strategy stands out as a highly structured, data-driven method for reading market momentum with precision.
For forex traders seeking consistent technical confirmation, it remains one of the most reliable volatility-based strategies available.