


When something is “overdone” in everyday life – like food in the oven or an engine overheating – our instinctive response is immediate correction. We pull the dish out before it burns further, or we stop the engine to prevent damage.
Because these reactions feel so natural, many new forex traders mistakenly apply the same logic to the market. When an indicator signals Overbought, they assume it’s time to sell. When it signals Oversold, they assume it’s time to buy. The assumption is that price will “snap back” like a stretched rubber band.
But financial markets don’t behave like casseroles or car engines.
In forex trading, Overbought and Oversold readings require context, patience, and an understanding of price behavior – not reflexive decision-making. Let’s explore why.
Why Overbought and Oversold Signals Mislead New Traders
Indicators like the Relative Strength Index (RSI) and Slow Stochastics can enter Overbought or Oversold territory and stay there for an extended period – especially during strong trends.
A reading above 70 or 80 on these indicators does not mean the market must immediately reverse.
Price does not behave like a compressed spring.
Trends can extend. Momentum can strengthen. Buyers or sellers can remain in control far longer than traders expect.
To illustrate this, let’s examine a real chart example.
A Real Example: NZD/JPY and Persistent Overbought Momentum
Consider the Daily chart of NZDJPY below:
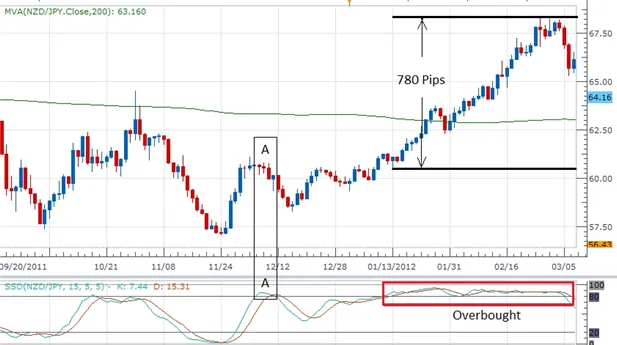
Notice how the first time Slow Stochastics crossed above 80 into Overbought territory, price continued to rally more than 780 pips, while Stochastics stayed overbought the entire time.
A beginner who immediately shorted simply because the indicator showed “Overbought” would:
- Miss the entire bullish trend
- Enter a position against the market’s momentum
- Likely get stopped out quickly
This example highlights a critical truth:
Overbought does not automatically mean reversal. Overbought often means strong bullish pressure is still active.
When Overbought Does Lead to a Pullback
Now examine the area labeled “A” on the same chart:
In this case, Stochastics remained Overbought, but the candlestick patterns – dojis, spinning tops, a shooting star, and eventually a hammer – signaled weakening momentum.
These price action clues suggested a possible pullback, and price reacted accordingly.
The lesson is powerful:
- Sometimes Overbought leads to a continuation
- Sometimes Overbought leads to a reversal
The outcome depends on market context, not just the indicator reading.
The Key Principle: Always Trade in the Direction of the Dominant Trend
Indicators should never be used in isolation.
When evaluating Overbought or Oversold conditions, always consider the direction of the longer-term trend.
If the dominant trend is strong and bullish:
- Overbought readings are normal
- They often signal continued buying pressure
- Shorting simply because an indicator is overbought increases risk
If the trend is strong and bearish:
- Oversold readings are expected
- Attempting to buy prematurely is risky
Trading against the trend because of an indicator reading is one of the most common – and costly – errors made by new traders.
Summary: What Traders Must Remember About Overbought/Oversold
- Overbought and Oversold are not automatic reversal signals
- Indicators can remain extended for long periods
- Price action and trend context matter more than the indicator alone
- Enter trades in the direction of the dominant trend
- Use candlestick patterns, support/resistance, and momentum structure to confirm setups
Understanding how to correctly interpret these signals will significantly strengthen your technical analysis and keep you aligned with real price behavior – not assumptions.


