


In forex trading, success does not come from using dozens of indicators at once. In fact, the most effective trading plans are often built around a small number of reliable technical tools.
When starting your trading journey, you will encounter countless strategies and indicator combinations. However, most high-probability setups can be identified using just four essential indicators:
- Moving Average
- RSI (Relative Strength Index)
- Slow Stochastic
- MACD
Mastering these four tools will help you identify market conditions, refine entries, and manage exits with greater confidence and discipline.
This guide explains how each indicator works and how professional traders use them in different market environments.
Why a Simple Trading Strategy Works Best
One of the most common mistakes among beginner traders is overcomplicating the trading process.
Many assume that a strategy with multiple indicators, filters, and confirmations must be more effective.
In practice, the opposite is often true.
A simple strategy offers several advantages:
- faster decision-making
- less emotional stress
- easier execution
- more consistent discipline
The more complex the system, the harder it becomes to follow under live market pressure.
This is why professional traders often prefer clear, repeatable rules over complicated frameworks.
A simple plan with well-defined entry and exit logic is usually the strongest ally when trading a live account.

The 4 Best Forex Indicators for a Simple Strategy
The following four indicators are among the most widely used in technical analysis.
They can be applied individually or in combination to identify high-probability trading opportunities.
Moving Average
The Moving Average is one of the most effective trend-following indicators in forex trading.
Its primary function is to smooth price data and reveal the overall market direction. A moving average calculates the average price of a currency pair over a specified period, such as:
- 50 periods
- 100 periods
- 200 periods
For example, a 200-day moving average is commonly used to assess long-term trend direction. When price remains above the moving average, the market is generally considered bullish. When price remains below it, the bias is typically bearish.
Professional traders use moving averages to:
- identify the trend
- locate pullback entries
- confirm momentum direction
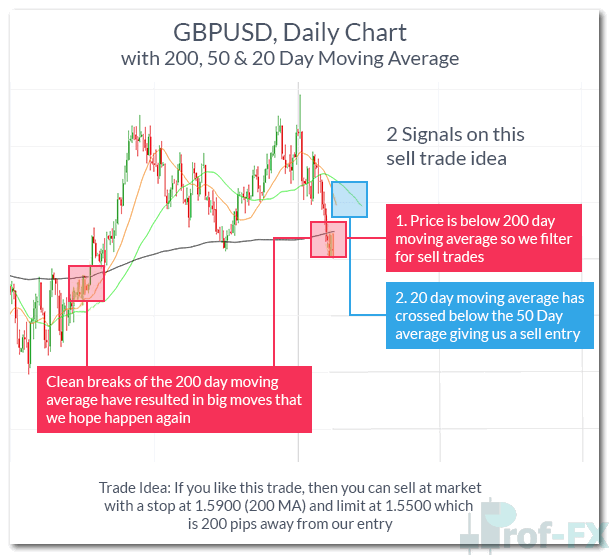
A common strategy is to buy when price retraces toward the moving average in an uptrend and sell when it rallies into the moving average in a downtrend.
This helps traders align positions with prevailing momentum.
RSI (Relative Strength Index)
The Relative Strength Index (RSI) is a momentum oscillator used to identify overbought and oversold conditions.
RSI is plotted on a scale from 0 to 100.
Key levels include:
- above 70 → overbought
- below 30 → oversold
These levels help traders anticipate potential reversals or pullback completions.
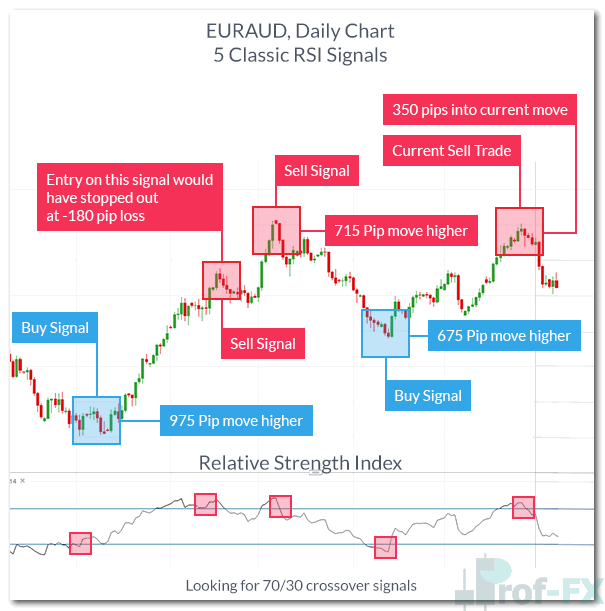
For traders who prefer to buy low and sell high, RSI is especially useful.
In ranging markets
RSI can be used to buy near oversold conditions and sell near overbought conditions.
In trending markets
RSI becomes even more powerful when used as a pullback tool. For example;
In an uptrend, traders often wait for RSI to dip below 30 and then recover before entering long positions in the direction of the trend. This improves timing and reduces chasing price.
Slow Stochastic
The Slow Stochastic Oscillator is another momentum-based tool designed to identify overbought and oversold zones.
Like RSI, it is highly effective in both trending and ranging conditions. Its unique advantage lies in its dual-line structure:
- %K line
- %D line
These lines generate signals through crossovers.
A common bullish signal occurs when:
- %K crosses above %D
- crossover happens near or below the 20 level
This often signals an oversold reversal.
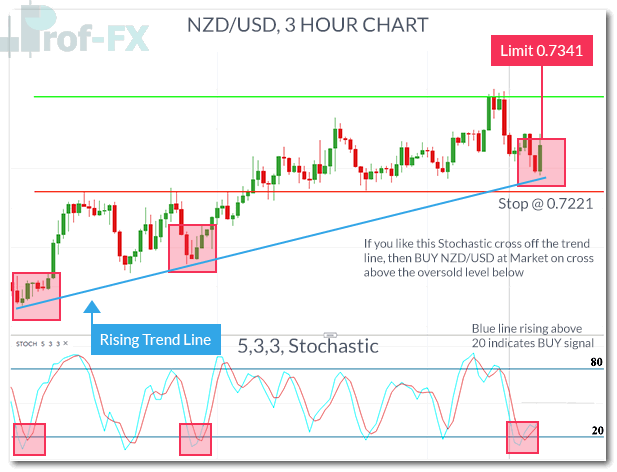
For bearish setups, traders look for %K crossing below %D near the 80 level. Stochastic is especially useful for identifying precise reversal timing.
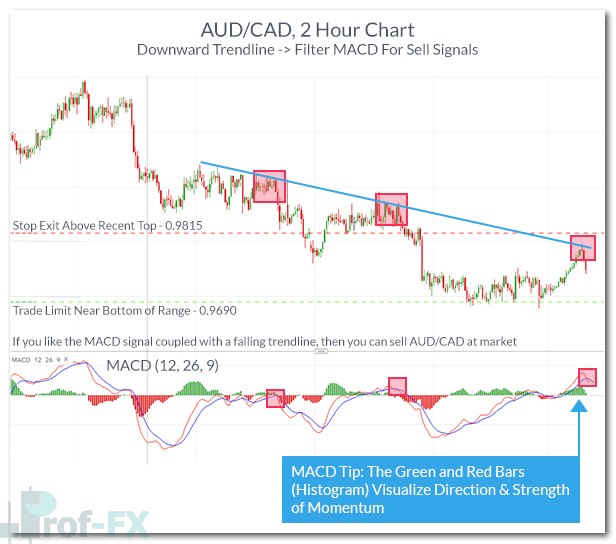
MACD (Moving Average Convergence Divergence)
The MACD indicator is one of the most respected momentum indicators in technical analysis.
Often referred to as the “king of oscillators,” MACD combines trend and momentum analysis.
It consists of:
- MACD line
- signal line
- zero line
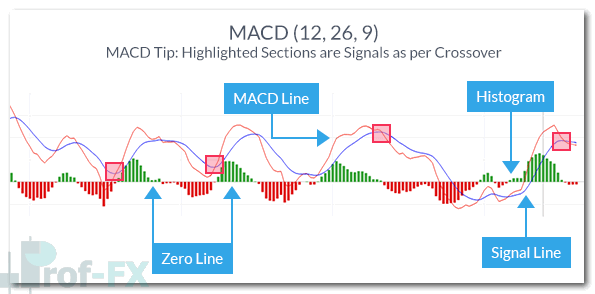
Professional traders focus on two main elements:
1. Position relative to zero line
- above zero → bullish bias
- below zero → bearish bias
2. MACD crossover
- MACD crossing above signal line → buy signal
- MACD crossing below signal line → sell signal
This makes MACD effective in both:
- trending markets
- range-bound markets
The strongest signals occur when crossovers align with the prevailing trend.
For example, In an uptrend, traders prioritize bullish MACD crossovers.
Using Indicators in Different Market Environments
Before using any indicator, traders must first identify the market environment.
There are generally two major conditions:
Ranging Market
Price moves between clear support and resistance.
Trending Market
Price steadily moves higher or lower. Indicators perform differently depending on the environment. For example:
- RSI and Stochastic work exceptionally well in ranges
- Moving Averages and MACD excel in trends
This is why professional analysis always begins with market structure first, indicator second.
Risk Management and Trade Execution
Indicators should never be used in isolation. They are most effective when combined with:
- trend analysis
- support and resistance
- candlestick confirmation
- risk-to-reward planning
A professional trading plan includes:
- entry signal
- stop loss
- take profit
- minimum positive risk-to-reward ratio
For example, after a MACD crossover, stops may be placed below the recent swing low, with profit targets set at 2x the risk.
This preserves long-term profitability even if the win rate is moderate.
Prof FX Trading Insight
The most important lesson is this, “master a few indicators deeply rather than using many indicators poorly.”
These four tools provide more than enough analytical depth for:
- trend identification
- momentum confirmation
- reversal timing
- entry refinement
Simplicity often leads to greater consistency.
Continue Improve Your Forex Knowledge
To improve your technical analysis skills further, it is highly recommended to continue studying:
- how to read forex quotes
- risk management strategies
- trend-following systems
- breakout trading strategies
A strong foundation in these four indicators will significantly improve your ability to execute trades with discipline and confidence.
Prof FX continues to provide authoritative forex news and technical analysis on the trends influencing the global currency markets.


