


The Bollinger Band® reversal pattern is one of the most frequently occurring setups across forex, equities, commodities, and indices. When applied correctly, this pattern can offer traders attractive risk-to-reward opportunities, making it suitable for both beginner and experienced forex traders.
In this article, I will explain how Bollinger Band® reversal patterns work, how to identify them step by step, and how traders can execute trades with structure and discipline. The explanation is presented in a descriptive, educational style, as if guiding you through a live market presentation.
What Is a Bollinger Band® Reversal Pattern?
A Bollinger Band® reversal pattern is a momentum-based reversal signal that forms when price action shows signs of exhaustion at the outer Bollinger Bands®. These patterns are most commonly associated with:
- Bullish reversals after a downtrend
- Bearish reversals after an uptrend
Technically, this setup closely resembles classic double bottom (“W”) and double top (“M”) chart patterns. What differentiates the Bollinger Band® version is the relationship between price and volatility, measured through the bands.
Why Bollinger Band® Reversals Matter
Bollinger Bands® adapt to volatility. When price pushes outside the bands, it suggests strong momentum. However, when that momentum fails to repeat on a second attempt, it often signals that the prevailing trend is losing strength.
This loss of momentum is what creates the opportunity for a reversal trade.
Key Characteristics of Bollinger Band® Reversal Patterns
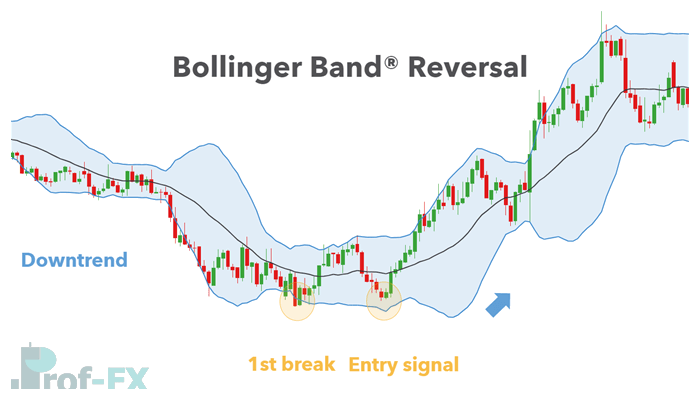
A valid Bollinger Band® reversal setup typically includes:
- A clear preceding trend (uptrend or downtrend)
- A first price extreme that breaks outside the Bollinger Band®
- A second price extreme that fails to break the band
- A structural confirmation, usually via a neckline break
This combination allows traders to avoid guessing tops and bottoms and instead wait for confirmation.
How to Identify a Bollinger Band® Reversal Pattern (Step by Step)
Below is a structured process for spotting this pattern on your chart:
Step 1: Apply the Bollinger Band® Indicator
- Use 20-period SMA
- Set 2 standard deviations
- Common timeframes: Daily or H1, though the pattern works across all timeframes
Step 2: Identify the Preceding Trend
- Use price action (higher highs / higher lows or lower highs / lower lows)
- Or confirm with trend indicators such as Moving Averages
Reversals are higher probability when they occur after a mature trend, not during consolidation.
Step 3: Spot a Double Top or Double Bottom
- In an uptrend, look for a double top (M pattern)
- In a downtrend, look for a double bottom (W pattern)
Step 4: Analyze the Interaction with Bollinger Bands®
- The first top/bottom must break outside the Bollinger Band®
- The second top/bottom must fail to break the band
This failure indicates weakening momentum.
Step 5: Wait for Entry Confirmation
- Traders may enter aggressively after the second top/bottom
- Or conservatively by waiting for a neckline break, which is the traditional and higher-probability approach
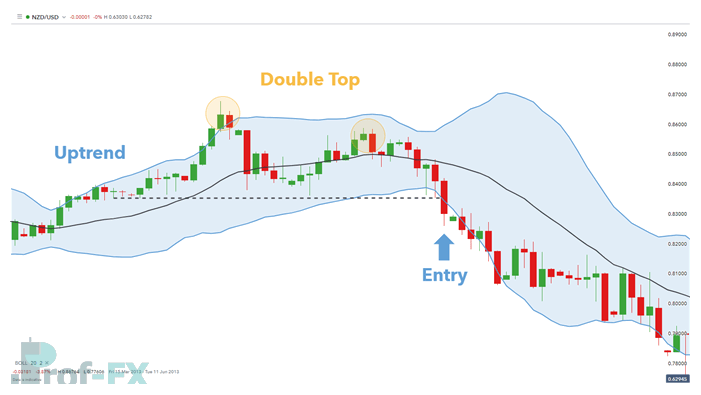
Example: Bearish Bollinger Band® Reversal on NZD/USD
Below is a practical example of a bearish Bollinger Band® reversal on the NZD/USD daily chart.
The broader trend is identified as an uptrend, based on higher highs and higher lows. Price then forms a double top structure.
- The first peak breaks above the upper Bollinger Band®
- The second peak fails to reach the upper band
This behavior signals that buyers are losing momentum, despite price being near previous highs.
Executing the Trade: Entry, Stop, and Target
Entry Strategy
While some traders enter immediately after the second top forms, a more disciplined approach is to:
- Use the neckline of the double top as a trigger
- Enter on:
- A clean break below the neckline, or
- A confirmed candle close below the neckline
This helps filter false signals.
Stop-Loss Placement
- Stops are typically placed above the most recent swing high
- This placement respects market structure and limits downside risk
Take-Profit Targets
Profit targets can be determined using:
- Key support levels
- Fibonacci retracement or extension levels
- Measured move techniques based on pattern height
Risk-to-reward ratios of 1:2 or better are commonly achievable with this setup.
Best Practices for Trading Bollinger Band® Reversals
To improve consistency, traders should:
- Avoid trading reversals in strong, accelerating trends
- Combine Bollinger Bands® with price structure
- Use proper risk management
- Treat Bollinger Band® reversals as confirmation tools, not standalone signals
Patience is critical—waiting for full confirmation often separates professional traders from impulsive ones.
Key Takeaways for Forex Traders
- Bollinger Band® reversal patterns are momentum exhaustion signals
- They work best when aligned with clear market structure
- The second failure to break the band is the core signal
- Neckline breaks offer high-quality confirmation
- Proper execution can deliver favorable risk-to-reward profiles
When applied with discipline and context, Bollinger Band® reversal patterns can become a reliable addition to a trader’s technical toolkit.
Further Reading on Bollinger Bands®
- Trade Forex with Bollinger Bands® (Beginner Guide)
- Using Bollinger Bands® in Day Trading Strategies
- Combining Bollinger Bands® and MACD for Confirmation
Bollinger Bands® is a registered trademark of John Bollinger.

")


