


One of the most powerful advantages of price action analysis is its ability to reveal meaningful price levels directly from market behavior. While there are many tools available to identify support and resistance, their true value depends on whether price actually reacts at those levels.
Candlestick wicks provide this confirmation. They visually represent rejection, making them one of the most reliable tools for identifying zones where supply and demand are actively influencing price.
Why Wicks Matter in Price Action
A wick forms when price moves in one direction but fails to hold those levels, reversing before the candle closes. This rejection reflects a shift in control between buyers and sellers.
- A long upper wick signals rejection of higher prices (potential resistance)
- A long lower wick signals rejection of lower prices (potential support)
These reactions are not theoretical—they are direct evidence of market participation. As such, they carry far more weight than static indicators alone.
Multi-Time Frame Perspective of Wicks
Wicks also highlight the importance of multiple time frame analysis.
A sharp reversal on a lower timeframe (e.g., hourly) may appear as a large wick on a higher timeframe (e.g., daily). This allows traders to:
- Filter noise from lower timeframes
- Identify significant reactions more clearly
- Focus on levels that matter across broader market participation
USD/JPY Daily Price Chart
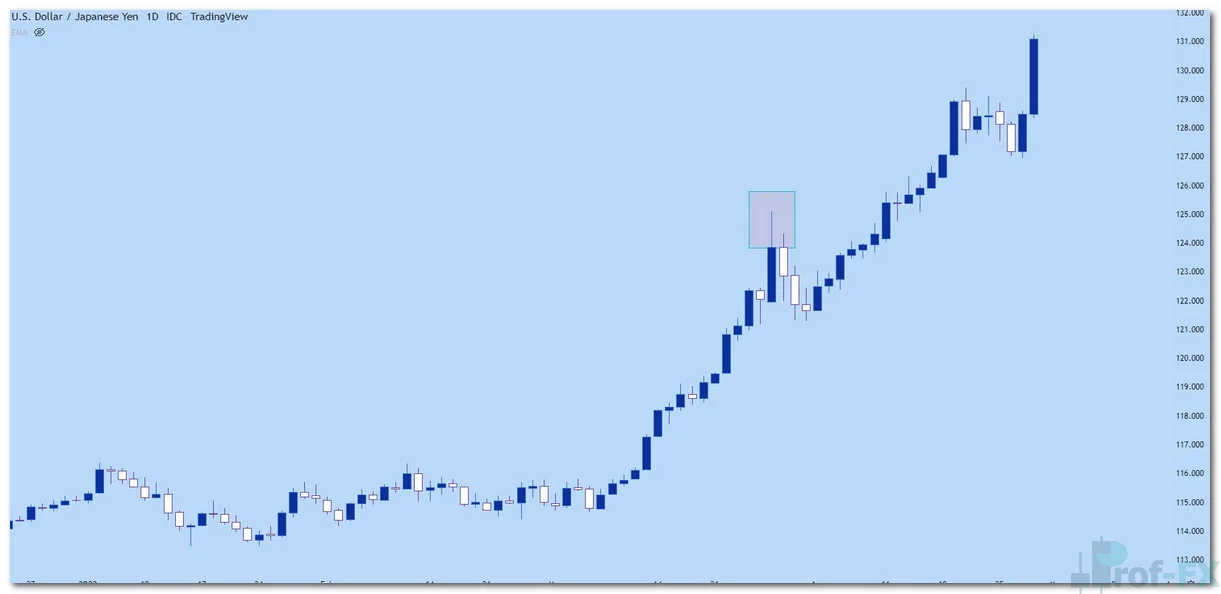
In the chart above, a prominent upper wick appears after a strong bullish move. This indicates that price attempted to continue higher but was aggressively rejected.
Notably, the sessions that followed showed continued downside movement. This confirms that the rejection was not temporary—it marked the beginning of a short-term shift in momentum.
Understanding the Same Move on a Lower Timeframe
To gain deeper insight, the same price action can be viewed on a lower timeframe:
USD/JPY Hourly Price Chart
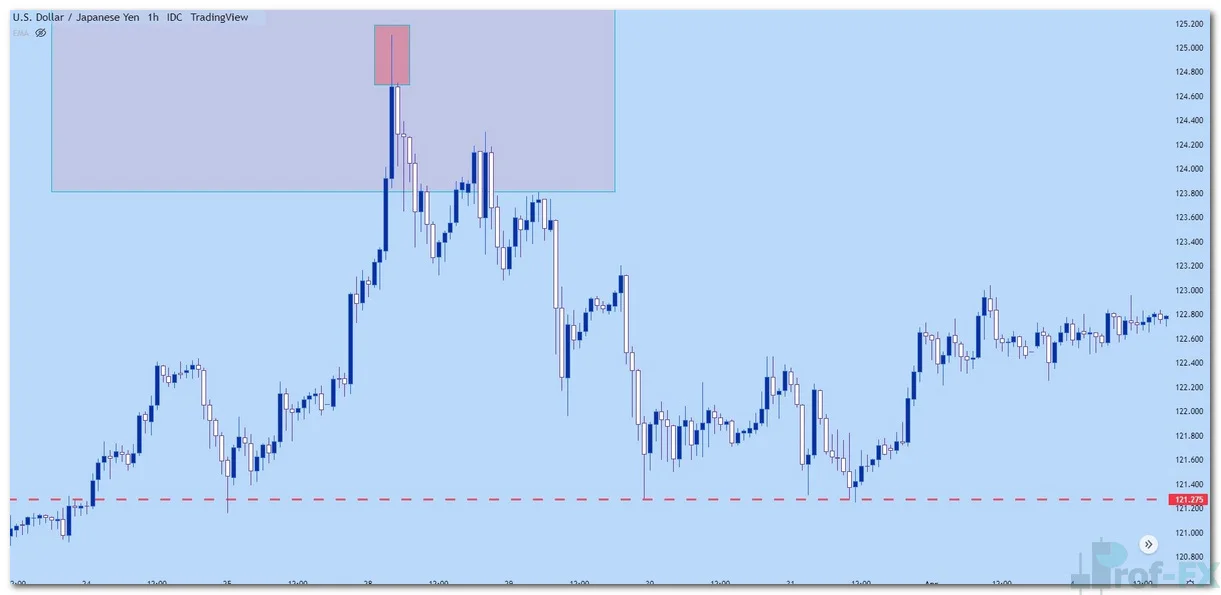
Here, the reversal becomes more detailed. What appears as a single wick on the daily chart is actually a sequence of price movements on the hourly chart:
- Initial upward momentum
- Sudden rejection
- Gradual follow-through to the downside
This demonstrates how higher timeframe wicks are often the result of complex lower timeframe activity.
What Drives Wick Formation?
Wicks are typically formed by:
- Sudden influx of orders (buying or selling pressure)
- Fundamental catalysts (economic news, policy changes, etc.)
- Profit-taking after extended moves
In this case, the reversal likely reflects new bearish information entering the market. As that information is priced in, the market transitions from upward momentum to a corrective or bearish phase.
Wicks and Trend Behavior
Importantly, this behavior aligns with how trends naturally evolve.
Markets rarely move in a straight line. Instead, they follow a rhythm:
- “Two steps forward, one step back” in uptrends
- “Two steps down, one step up” in downtrends
The wick often marks the turning point where this shift begins. It highlights the moment when the prior trend loses strength and opposing pressure emerges.
Wicks as Support and Resistance Indicators
One of the most practical uses of wicks is identifying future support and resistance levels.
In the hourly chart above, a horizontal level (marked by the red line) emerges as a key area where price reacts. This level becomes a reference point for future analysis:
- Traders may look for buying interest if price returns to support
- Or selling pressure if the level breaks and flips into resistance
This demonstrates how a single wick can evolve into a structurally important level in the market.
Key Takeaway
Candlestick wicks are a direct reflection of market rejection and sentiment shifts. Their importance lies in their ability to:
- Identify key support and resistance zones
- Reveal momentum changes
- Bridge analysis across multiple timeframes
From a professional standpoint, wicks should not be viewed as minor details. They are critical components of price action that provide early insight into potential market turning points and help traders build a structured, evidence-based trading approach.


