


What is Exponential Moving Average (EMA)?
The Exponential Moving Average (EMA) is a refined version of the Simple Moving Average (SMA), a popular technical analysis indicator. Unlike the SMA, which gives equal weight to all price data over a specific period, the EMA places greater emphasis on recent price movements. This results in the EMA being more reactive to current price fluctuations compared to the SMA.
For instance, the chart below illustrates the distinction between the SMA and EMA. Notice how the 200-EMA reacts more swiftly to a downward price trend on the left side of the chart. Similarly, during a price increase, the EMA demonstrates a smaller lag compared to the SMA, underscoring its sensitivity.

How is the Exponential Moving Average (EMA) Calculated?
Most modern charting platforms automatically calculate and apply the EMA to your trading charts, saving you the complexity of manual computation. However, understanding the formula can deepen your grasp of this tool and its behavior.
The EMA is a weighted moving average that adjusts the average price over a defined period to emphasize recent price data. Below is the formula for EMA calculation, breaking down its components for clarity:
EMA = Price (t) x k + EMA (y) x (1-k)
where:
- t: today
- y: yesterday
- N: number of days in EMA
- k: 2 / (N+1)
How to Use the Exponential Moving Average in Your Trading Strategy
Traders often incorporate the EMA into their strategies in ways similar to the SMA. One common approach is using EMA crossovers to identify potential buy and sell signals:
- When a shorter-term EMA crosses above a longer-term EMA, it generates a buy signal.
- Conversely, when a shorter-term EMA crosses below a longer-term EMA, it suggests a sell signal.
The specific EMA periods are customizable based on individual trader preferences. For example, some traders opt for 20, 50, and 200 EMA periods, while others may choose Fibonacci-based numbers.
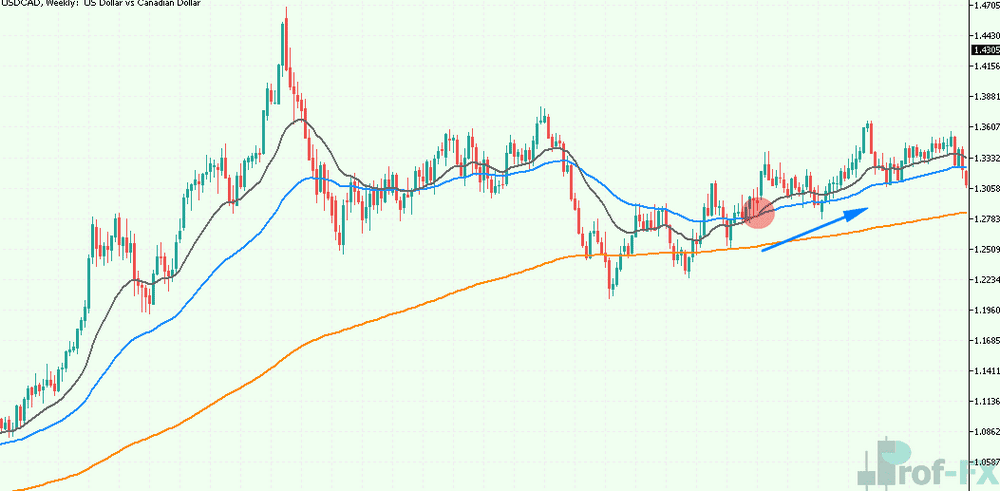
The chart below displays a USD/CAD daily chart with 20, 50, and 200 EMA indicators applied. In this example:
- The 200 EMA helps identify the broader trend. From 2014 to mid-2017, prices remain above the 200 EMA, indicating an upward trend. A subsequent dip below the 200 EMA suggests a neutral trend, followed by a resumption of the upward trajectory.
- Shorter-term EMA crossovers (e.g., the 20 EMA crossing above the 50 EMA) provide potential entry points for trades. The highlighted circle on the chart marks a buy signal.
Exponential Moving Average: A Summary
The EMA is an essential tool for traders of all experience levels. For beginners, it offers a straightforward method to identify trends and potential entry points in the market. Advanced traders often combine the EMA with other indicators to refine their strategies, but its significance remains intact.
Steps to Trade Using the EMA:
- Use a long-term EMA to determine the overall trend.
- Monitor crossover points between shorter-term and longer-term EMAs.
- Execute long or short positions based on these crossover signals.
By integrating the EMA into your trading routine, you can enhance your ability to spot trends and make informed trading decisions. Become a better trader today by mastering tools like the EMA and expanding your technical analysis skills.


