


Breakout trading has become increasingly popular among forex traders, especially when currency pairs spend long periods consolidating within clearly defined ranges. The basic concept is straightforward: traders look to buy when price breaks above resistance or sell when price breaks below support.
However, one critical question consistently concerns traders—particularly beginners:
Can false breakouts be prevented?
Understanding how false breakouts occur and, more importantly, how to manage them effectively is essential for anyone using a breakout strategy.
What Is a False Breakout in Forex Trading?
A false breakout occurs when price briefly moves beyond a key support or resistance level, triggering entries, but then quickly reverses direction and moves back into the prior range. These situations often lead to premature losses and frustration among breakout traders.
Below is an example of a false breakout on the EUR/USD currency pair.
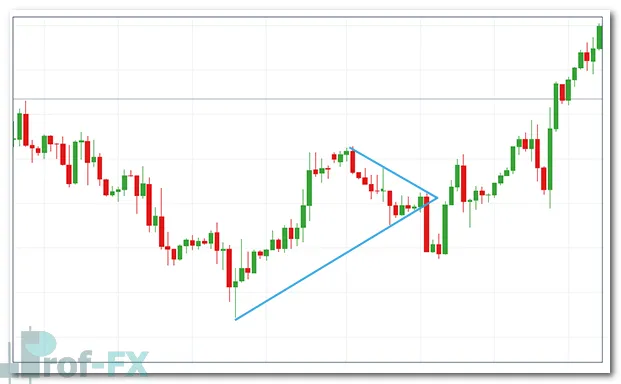
In this case, support had been forming during early trading, highlighted by a series of higher lows, suggesting a tightening range. Price eventually broke below support, likely triggering new short positions. Instead of continuing lower, however, price quickly reversed and moved higher—invalidating the breakout.
Naturally, this raises an important question:
Were there warning signs that price would retrace after breaking support?
Why Indicators Often Fail During Breakouts
Many traders instinctively turn to indicators for answers. Unfortunately, this is where a common misconception arises.
All technical indicators—whether oscillators, moving averages, price channels, or Bollinger Bands—are lagging by nature. They are derived from historical price action, not future price movement. Indicators interpret what has already happened in an attempt to project direction.
For breakout traders, this creates a major challenge. Price can reverse sharply and aggressively, often faster than indicators can update. As a result, relying on indicators to filter false breakouts frequently leaves traders reacting too late.
This does not mean indicators are useless—but it does mean they are not reliable tools for preventing false breakouts.
What Traders Can Actually Control: Risk Management
While traders cannot control market behavior, risk management is entirely within our control. This is where the focus should shift.
Before entering any breakout trade, a trader must answer one critical question:
How many pips am I willing to risk in order to pursue a profitable move?
By defining risk in advance, false breakouts become a manageable part of trading rather than a threat.
Case Study: USDCAD Breakout on the Daily Chart
Let’s examine a practical example using the USDCAD daily chart, as discussed by Martin Thomas in a Weekly Trading Lesson.
At the time of analysis, price had broken below a long-standing range, with many breakout traders choosing to enter fresh sell positions below 0.9850.
Rather than focusing on whether the breakout would fail, the emphasis shifts to how risk is structured.
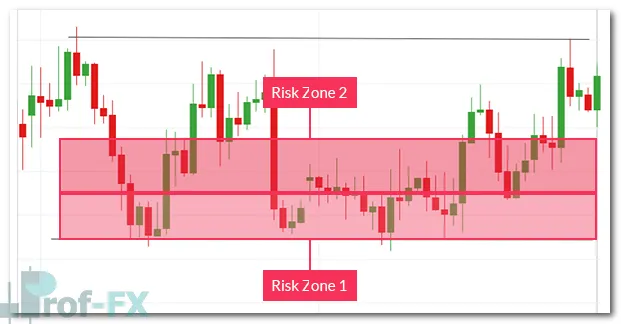
Defining Risk Zones for Breakout Trades
In this example, total risk is divided into two zones, each representing half the distance of the prior range.
Risk Zone 1: Aggressive Stop Placement
Aggressive traders may choose to place stop-loss orders in Risk Zone 1, closer to the breakout level.
- Trades are exited quickly if price retraces
- Overall pip risk is minimized
- Stop-outs occur more frequently
- Trades may not have enough room to recover and continue in the breakout direction
This approach favors capital preservation but requires accepting a higher frequency of small losses.
Risk Zone 2: Conservative Stop Placement
More conservative traders may opt for Risk Zone 2, placing stops farther away—up to 0.9950 on USDCAD, representing roughly 100 pips of risk.
- Trades have more room to develop
- Temporary retracements are less likely to stop out the position
- Fewer stop-outs occur
- Losses are larger when trades fail
This approach prioritizes trade longevity but comes at the cost of increased pip risk.
Understanding the Risk Paradigm
The relationship between stop placement and outcomes can be summarized clearly:
RISK Paradigm
- Aggressive Stops
- More stop-outs
- Less pip risk
- Conservative Stops
- Fewer stop-outs
- More pip risk
There is no “correct” choice—only the one that best fits your trading psychology and risk tolerance.
Shifting Focus Away from False Breakouts
Once a trader defines their preferred risk approach, false breakouts lose much of their emotional impact. Instead of trying to predict whether a breakout will fail, the trader accepts that some breakouts will fail by design.
By focusing on controllable factors—such as stop placement, position sizing, and predefined risk—breakout trading becomes more structured and repeatable.
Final Thoughts for Breakout Traders
False breakouts cannot be eliminated entirely, and attempting to do so often leads traders toward overcomplication. Indicators will not save you from every failed breakout, nor are they designed to.
What truly matters is:
- Understanding support and resistance
- Accepting the probabilistic nature of breakouts
- Choosing a risk model that fits your personality
- Executing consistently without emotional interference
When risk is planned properly, false breakouts become just another cost of doing business—and not an obstacle to long-term success in forex trading.


