


Stop-loss placement is one of the most challenging aspects of trading, particularly for newer market participants. Determining the optimal distance for a stop involves balancing protection against unnecessary losses while allowing sufficient room for price fluctuations.
If a stop is set too tight, the position may be prematurely closed due to normal market volatility often referred to as being “wicked out”, before price moves in the anticipated direction. Conversely, placing a stop too wide exposes the trader to larger-than-intended losses, which can significantly impact overall account performance.
This uncertainty frequently leads to indecision. In some cases, traders may even avoid placing stop loss orders altogether, a practice that introduces substantial risk. From a professional risk management perspective, this approach is fundamentally flawed. Large losses are disproportionately difficult to recover. For instance, a 50% drawdown requires a 100% return just to return to the original account balance. Achieving such recovery is statistically challenging, particularly under emotional pressure following significant losses.
A more effective and disciplined approach is to prevent excessive drawdowns from occurring in the first place. This is where structured risk management tools such as the Average True Range (ATR) become essential.
WHAT IS ATR?
The Average True Range (ATR) is a technical indicator developed to measure market volatility. Unlike indicators that attempt to predict direction (bullish or bearish), ATR focuses solely on the magnitude of price movement over a specified period.
As volatility increases, ATR rises. When market activity contracts, ATR declines. This makes it a reliable, objective measure of how much price is moving, rather than where it is likely to move.
EUR/USD Daily Price Chart
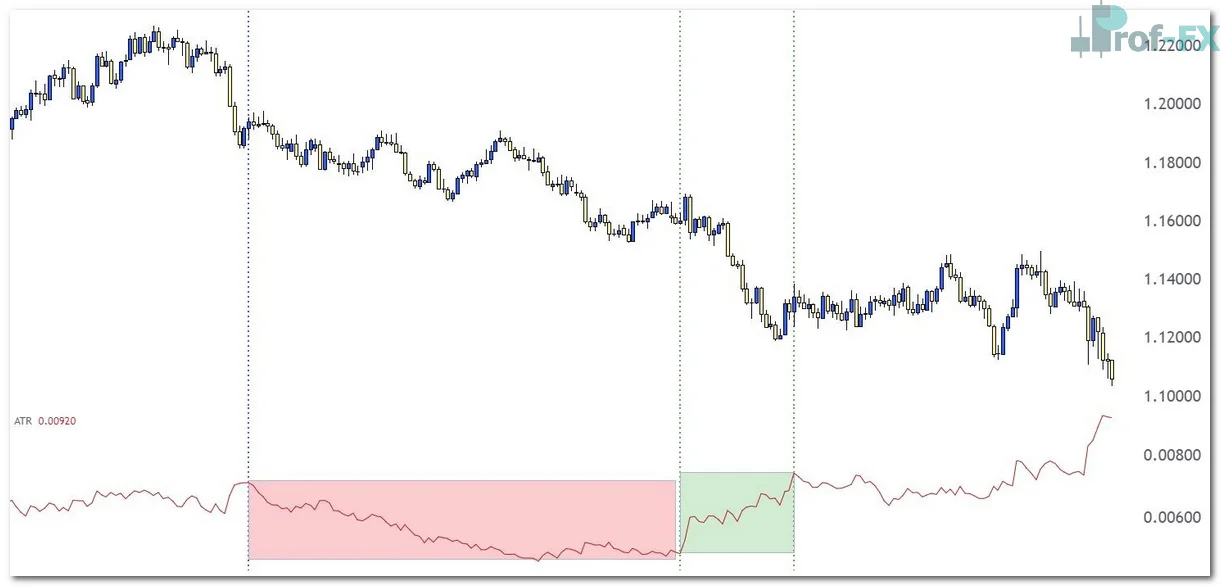
In the chart above, observe how ATR behaves during different market conditions. In the highlighted red zone, price trends downward at a relatively slow pace, and ATR gradually declines. This reflects a contraction in the average range of price movement over the selected lookback period.
In contrast, the green zone illustrates a more aggressive price movement. As volatility expands, ATR rises accordingly, signaling larger price ranges. This dynamic behavior confirms that ATR responds directly to changes in volatility.
Importantly, ATR is directionally neutral. It does not distinguish between bullish and bearish movements; it only measures the size of price fluctuations. Larger movements regardless of direction result in higher ATR values.
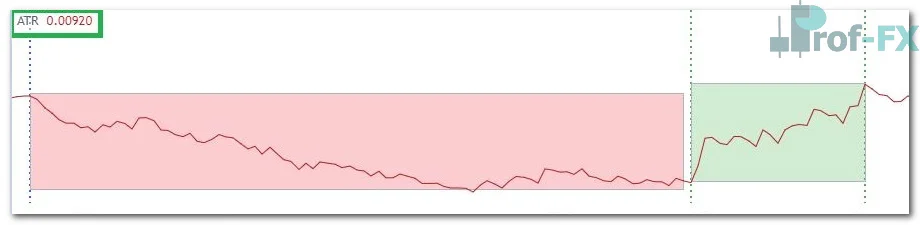
Another key aspect of ATR is its format. The indicator is expressed in the same units as price. For example:
- An ATR value of 00920 on EUR/USD equals 92 pips
- An ATR value of 00418 equals 41.8 pips
- An ATR value of 01295 equals 129.5 pips
This direct relationship to price makes ATR highly practical for real-time trading decisions, particularly in forex markets.
SETTING STOPS WITH ATR
Once a trader understands how to interpret ATR, applying it to risk management becomes straightforward and highly effective. The indicator provides a data-driven framework for determining appropriate stop-loss distances based on current market volatility.
For example, if ATR on the EUR/USD daily chart is reading 92 pips, this value can serve as a baseline for stop placement. Traders may choose from several approaches depending on their strategy and risk tolerance:
- Standard ATR Stop: Place the stop-loss at a distance equal to the current ATR value.
- Tighter Stop (e.g., 0.5x ATR): Suitable for short-term or more aggressive strategies, reducing risk exposure but increasing the likelihood of early stop-outs.
- Wider Stop (e.g., 2x ATR): Provides more room for price fluctuations, often used in swing or position trading, but with increased potential loss per trade.
This flexibility allows traders to align stop placement with both market conditions and individual risk preferences. More importantly, ATR introduces an objective and consistent methodology, removing emotional bias from the decision-making process.
From an expert standpoint, integrating ATR into a trading plan significantly enhances risk control. By adapting stop distances to current volatility, traders can maintain proportional risk exposure across varying market environments. This not only improves trade consistency but also contributes to long-term capital preservation.
STRATEGIC CONCLUSION
The use of ATR in risk management represents a structured and professional approach to trading. Rather than relying on arbitrary stop placement, traders can base their decisions on measurable market behavior.
In practice, ATR should be viewed as a foundational tool within a broader risk management framework. When combined with position sizing, proper leverage control, and disciplined execution, it enables traders to minimize drawdowns and sustain performance over time.
Ultimately, consistent application of ATR-based stop placement is not merely a tactical adjustment it is a critical component of long-term trading success.


