Understanding the Bearish Engulfing Pattern in Forex Trading
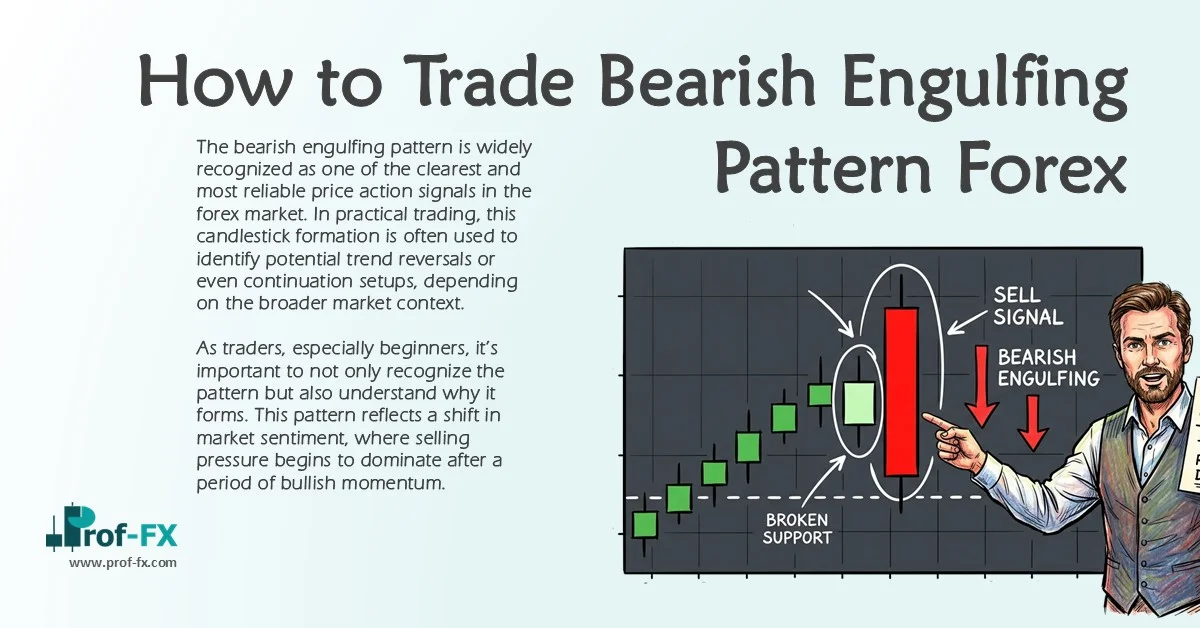
The bearish engulfing pattern is widely recognized as one of the clearest and most reliable price action signals in the forex market. In practical trading, this candlestick formation is often used to identify potential trend reversals or even continuation setups, depending on the broader market context.
As traders, especially beginners, it’s important to not only recognize the pattern but also understand why it forms. This pattern reflects a shift in market sentiment, where selling pressure begins to dominate after a period of bullish momentum.
In this guide, we will walk through:
- The definition of a bearish engulfing pattern
- How to identify and interpret it correctly
- Practical ways to trade it using confirmation tools
Before going deeper, make sure you are comfortable reading candlestick charts, as this pattern relies heavily on candle structure and behavior.
What Is a Bearish Engulfing Pattern?
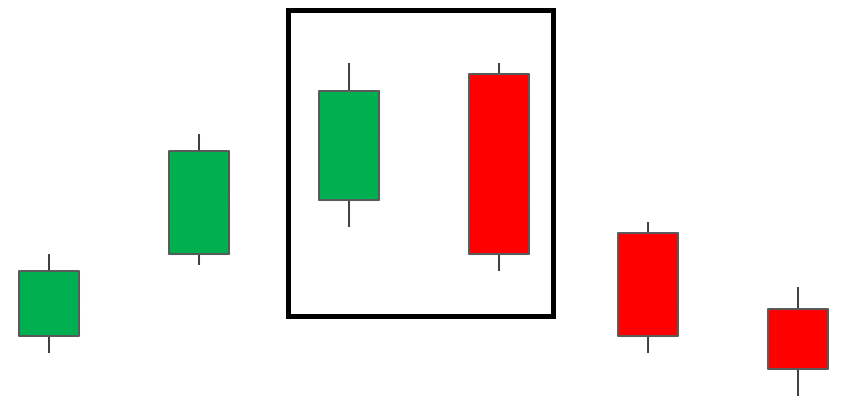
A bearish engulfing pattern typically appears at the end of an uptrend, signaling a potential reversal to the downside. It consists of two consecutive candles that tell a clear story about market control.
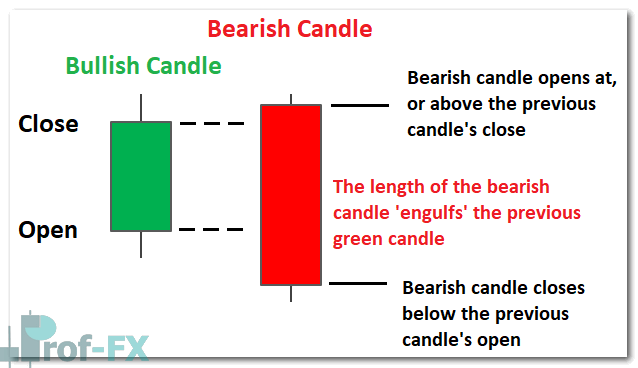
Structure of the Pattern
The pattern is formed through the interaction of two candles:
First Candle (Bullish Candle):
This candle represents the final phase of the existing uptrend. While its size can vary, it is usually bullish (green). Smaller candles such as doji or weak bullish candles, can actually strengthen the signal, as they often reflect market indecision.
Second Candle (Bearish Candle):
This is the key signal candle. It is a strong bearish (red) candle that:
- Opens above the previous candle’s close
- Closes below the previous candle’s low
- Fully engulfs the body of the first candle
This aggressive downward move indicates that sellers have overtaken buyers, often leading to further price declines. The larger and stronger this bearish candle, the more significant the signal becomes.
Bearish vs Bullish Engulfing Pattern: Key Differences
To avoid confusion and false signals, traders must clearly distinguish between bearish and bullish engulfing patterns.
The bullish engulfing pattern is essentially the opposite. It appears at the bottom of a downtrend and signals a potential upward reversal, where buyers regain control.
Bullish Engulfing Example
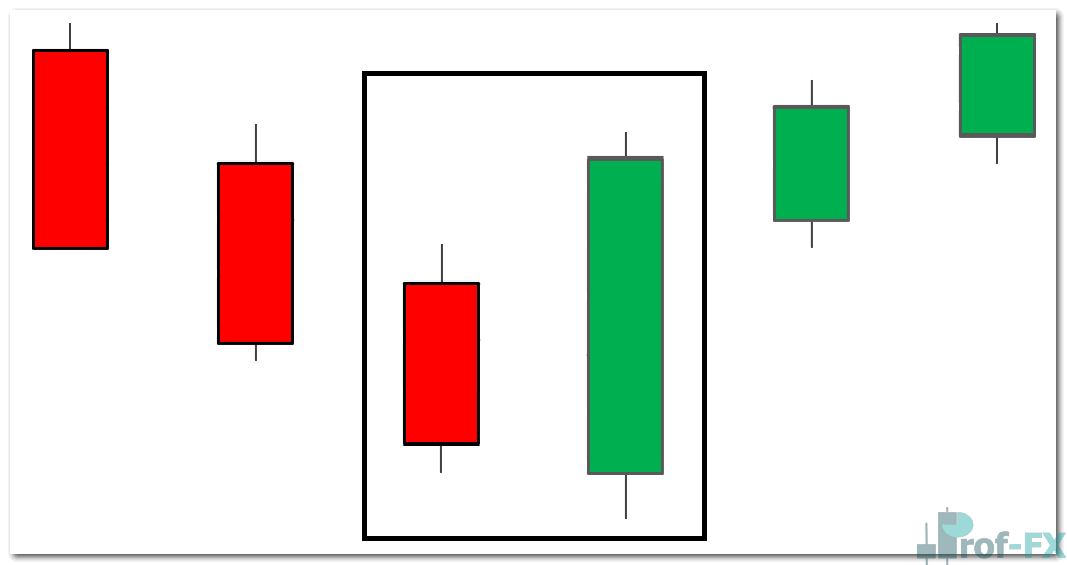
Core Differences Between the Two Patterns
| Engulfing Pattern | Characteristics | Location | Signal |
| Bullish Engulfing | Large green candle engulfs smaller red candle | Bottom of downtrend | Bullish reversal |
| Bearish Engulfing | Large red candle engulfs smaller green candle | Top of uptrend | Bearish reversal |
Understanding these differences is essential, as misidentifying the pattern can lead to poor trade decisions.
How to Trade the Bearish Engulfing Pattern Effectively
While the bearish engulfing pattern is powerful, professional traders never rely on a single signal alone. The key is confirmation using additional tools such as indicators, support and resistance levels, and overall market structure.
Below are two widely used approaches to strengthen your trading decisions.
Strategy 1: Using Indicators for Confirmation
One effective method is combining the bearish engulfing pattern with technical indicators like the Relative Strength Index (RSI).
For example, consider a scenario on the EUR/USD daily chart:
- The market is in a clear uptrend
- A bearish engulfing pattern forms at the top
- The RSI shows an overbought condition
This combination increases the probability of a downward reversal.
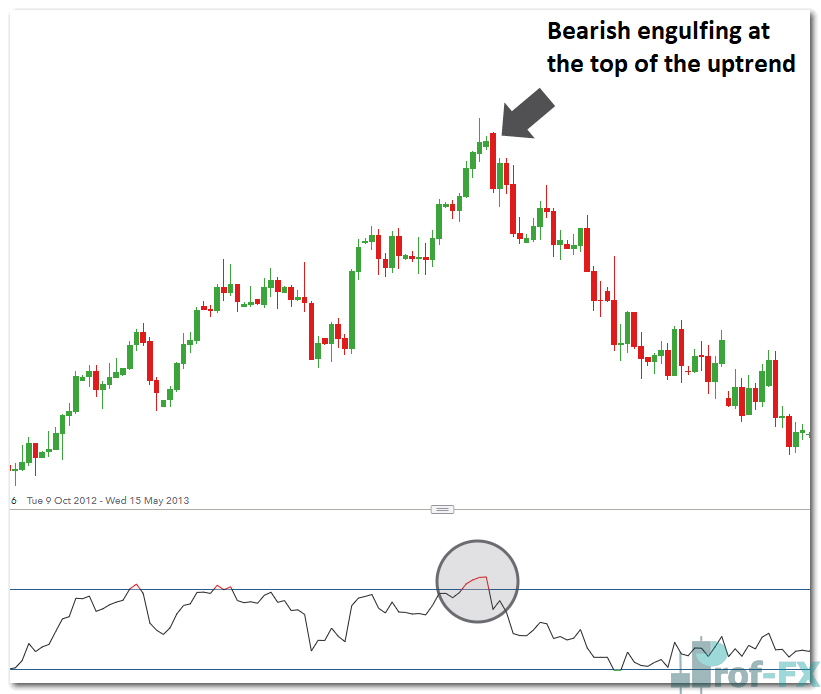
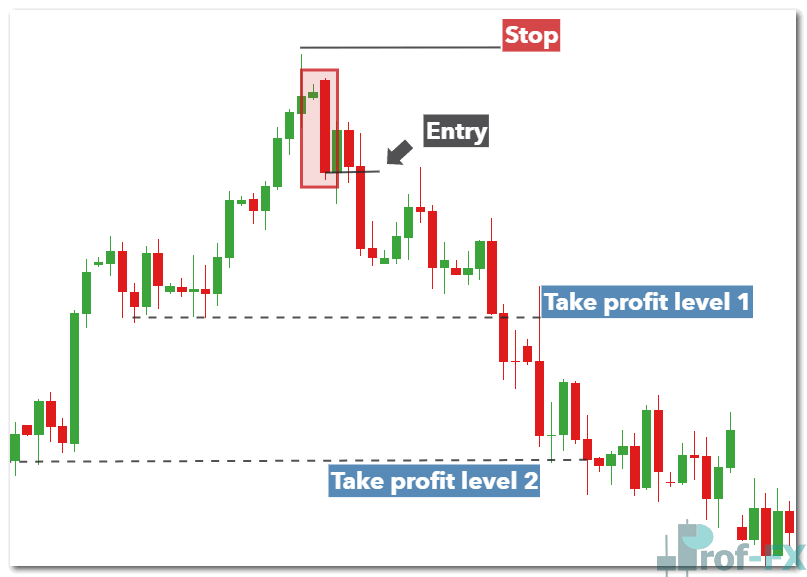
Trade Setup Example
Entry:
Wait for the price to break below the low of the bearish engulfing candle, or place a pending order slightly below it.
Stop Loss:
Place the stop above the recent swing high. This level invalidates the setup if broken.
Take Profit:
Set an initial target at a nearby support level. Since this pattern can signal the start of a larger downtrend, consider:
- Letting profits run
- Using a trailing stop
- Scaling out positions
Strategy 2: Using Support and Resistance Levels
Another powerful approach is combining the pattern with key resistance levels.
When a bearish engulfing pattern forms at resistance, it suggests that price has been rejected from higher levels, reinforcing the bearish bias.
For instance, on the US Dollar Index (DXY) chart:
- Price tests a strong resistance zone
- A bearish engulfing candle forms
- Sellers step in aggressively
This creates a high-probability setup.
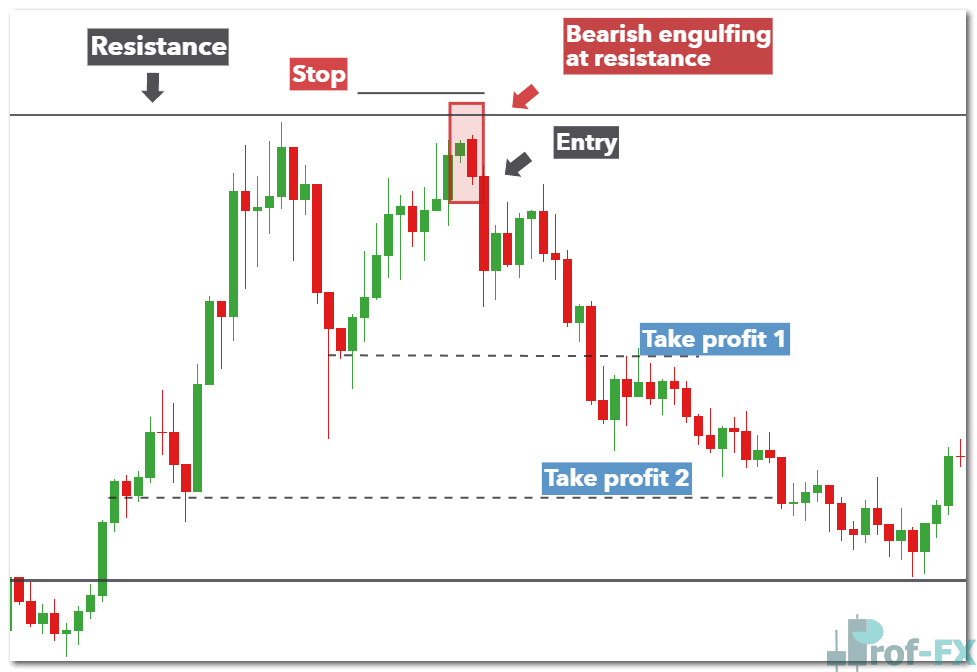
Trade Setup Example
Entry:
Enter at the opening of the next candle after the bearish engulfing pattern forms.
Stop Loss:
Place the stop above both:
- The engulfing candle
- The resistance level
If price breaks above this zone, the setup is no longer valid.
Take Profit:
Target the nearest support level. Advanced traders may:
- Set multiple targets
- Use trailing stops to capture extended moves
Final Thoughts on Trading Bearish Engulfing Patterns
The bearish engulfing pattern is a high-impact price action signal, but its true strength lies in context. When combined with tools like:
- RSI (Relative Strength Index)
- Support and Resistance
- Market structure and trend analysis
…it becomes significantly more reliable.
As a trader, your goal is not just to spot patterns, but to understand the story behind price movement. The bearish engulfing pattern tells a very clear story:
buyers are losing control, and sellers are stepping in with strength.
Additional Learning for Forex Traders
To further develop your trading skills, consider exploring:
- Other candlestick patterns and their applications
- Multi-timeframe analysis
- Risk management and position sizing
Remember, consistency in trading comes from combining technical knowledge, discipline, and confirmation strategies, not from relying on a single pattern alone.
Prof FX delivers forex news and technical analysis covering key trends that shape the global currency markets.