One of the most effective ways to simplify trading is by following a structured trading plan that includes a reliable technical indicator such as the MACD (Moving Average Convergence/Divergence).
This article explores a practical MACD trading strategy and explains how traders can use it to identify both the direction and momentum of a trend, while also improving entry and risk management decisions.
MACD Trading Strategy to Find and Enter a Trend
Identifying the trend is arguably one of the most important tasks every technical trader must master.
While trend recognition may initially seem complex, the MACD can be an extremely effective tool in simplifying this process.
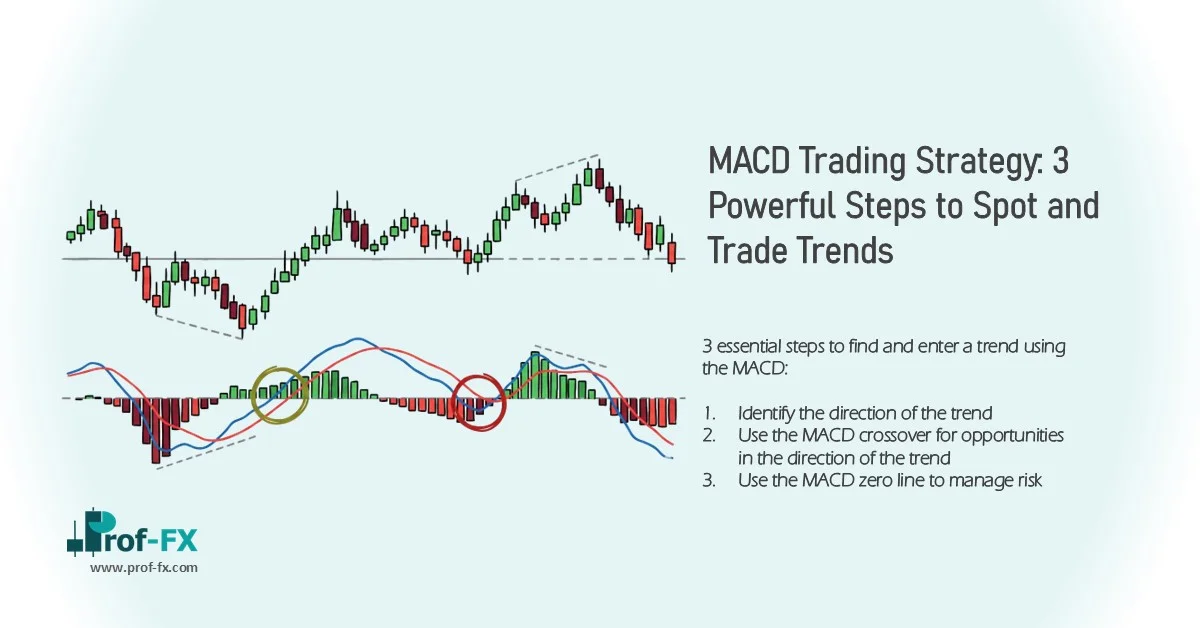
Below are three essential steps to find and enter a trend using the MACD:
- Identify the direction of the trend
- Use the MACD crossover for opportunities in the direction of the trend
- Use the MACD zero line to manage risk
1. Identify direction of the trend
One of the most effective ways to determine trend direction is by using the 200-day moving average.
If a trader is looking for buy opportunities, they can apply the 200-day moving average to the price chart to assess whether price is consistently trading above its broader average range.
A sustained price position above the 200-day moving average typically signals a prevailing uptrend.
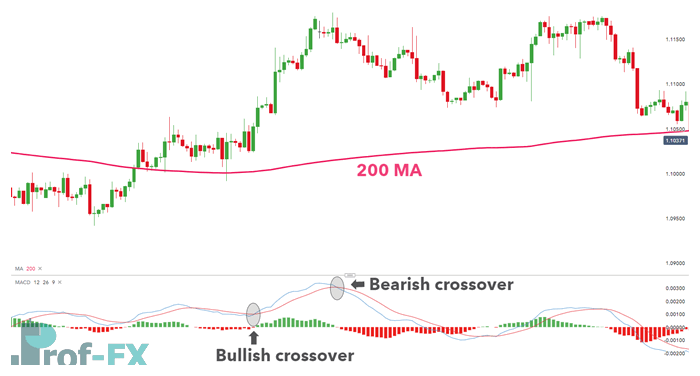
In the example below, the EUR/USD chart clearly shows an established bullish trend, confirmed by price consistently remaining above the 200-day moving average.
This serves as the first layer of objective trend confirmation.
Once this condition is met, the trader can proceed to the next step to identify a potential entry point.
From a professional trading perspective, using the 200-day moving average as a trend filter helps eliminate lower-probability trades that move against the broader market structure.
2. Use MACD crossover for opportunities in the direction of the trend
Once the market bias has been established, traders should begin looking for entry signals only in the direction of the prevailing trend.
In the example above, since price is trading ABOVE the 200-day moving average, the bias remains bullish.
At this stage, the MACD crossover becomes the primary execution tool.
A potential buy signal occurs when the MACD line (blue line) crosses above the signal line (red line) while price continues to trade above the 200-day moving average.
As illustrated on the chart, a trader may consider entering a long position at the first highlighted MACD crossover.
This dual-confirmation approach is highly effective because it combines:
- trend direction confirmation
- momentum-based entry timing
This structured process materially improves signal quality.
From an authoritative trading standpoint, using the MACD crossover without first confirming trend direction often increases exposure to false signals.
3. Use MACD zero line to manage risk
When trading trends, it is essential to recognize that no trend lasts forever.
Eventually, every bullish or bearish move begins to weaken.
In an uptrend such as the EUR/USD example, a bearish MACD crossover may signal that bullish momentum is slowing and that the market could potentially be preparing for a directional shift.
A trader already holding a long position may consider exiting at this stage.
However, professional risk management requires avoiding premature exits caused by minor pullbacks.
For this reason, traders often wait for additional confirmation by monitoring whether the signal line crosses below the zero line.
Once this occurs, it provides stronger evidence that bearish momentum is becoming dominant and that the uptrend may be ending.
At this point, exiting the trade becomes a more disciplined and data-backed decision.
This method helps balance profit protection with trend continuation.
MACD Strategy to Identify Tired Trends
A trend-following strategy remains one of the most widely used methods among both beginner and experienced traders.
One of the most common mistakes, however, is entering a trade near the end of an existing trend, only to watch the market reverse shortly afterward.
This is where the MACD can provide significant value.
A highly effective way to identify weakening trends is through MACD divergence.
Divergence occurs when the MACD indicator moves in a different direction from price action.
This often suggests that the current trend is losing momentum.
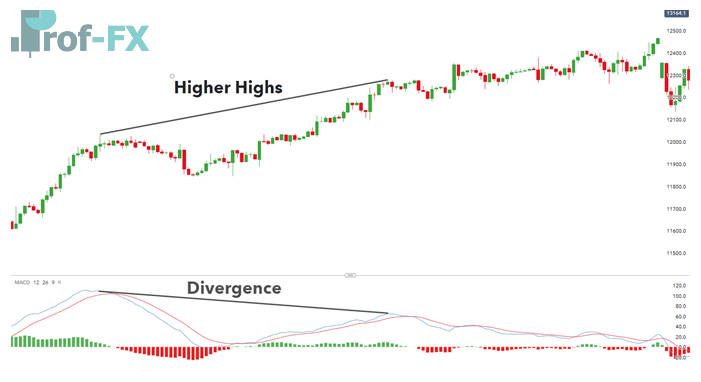
For example, in the chart below, the Germany 30 index forms a higher high on the price chart, while the MACD simultaneously forms a lower high.
This is a classic example of bearish divergence.
It serves as an early warning sign that bullish momentum is weakening.
At this stage, traders should strongly consider:
- reducing exposure
- tightening stop loss placement
- partially closing long positions
- preparing for a full exit
From a professional trading standpoint, divergence is one of the most reliable early indicators of trend fatigue.
Using crossover after divergence for execution
Once divergence has been identified, traders can then look for execution using the traditional MACD crossover.
For traders already holding long positions, the next bearish crossover—where the blue MACD line crosses below the red signal line—can serve as an effective exit trigger.
This helps protect unrealized profits and reduces the risk of being caught in a larger reversal.
While the MACD trading strategy is often associated with identifying entries, it is equally effective as an exit and risk management tool, particularly when used alongside divergence analysis.
Although entry timing is critically important, risk management must always remain the priority.
This is a principle consistently followed by experienced Forex traders.
MACD Trading Strategy FAQ
Is there a faster method to enter trades using the MACD indicator?
Yes.
While the MACD crossover remains the most widely used method for entry signals, the MACD histogram can serve as an alternative and often faster signal.
This method is commonly used by less conservative traders seeking earlier entries before the full crossover occurs.
However, earlier entries may also involve increased risk of false signals.
What other tools are useful when entering trades with MACD?
Although the MACD is a highly effective technical indicator, it can become even more powerful when combined with additional tools.
For example, sentiment data can be used to assess how other traders are positioned in the market.
By combining:
- trend structure
- MACD momentum
- market sentiment
- price action
traders can develop a more holistic view of the market.
This significantly improves decision-making for both entries and exits.
Improve Your Trading Skills
Interested in learning more about MACD?
Find out how to adjust MACD settings to make the most of your trades.
If you are still searching for indicators that align with your trading strategy, read 4 effective trading indicators every trader should know.