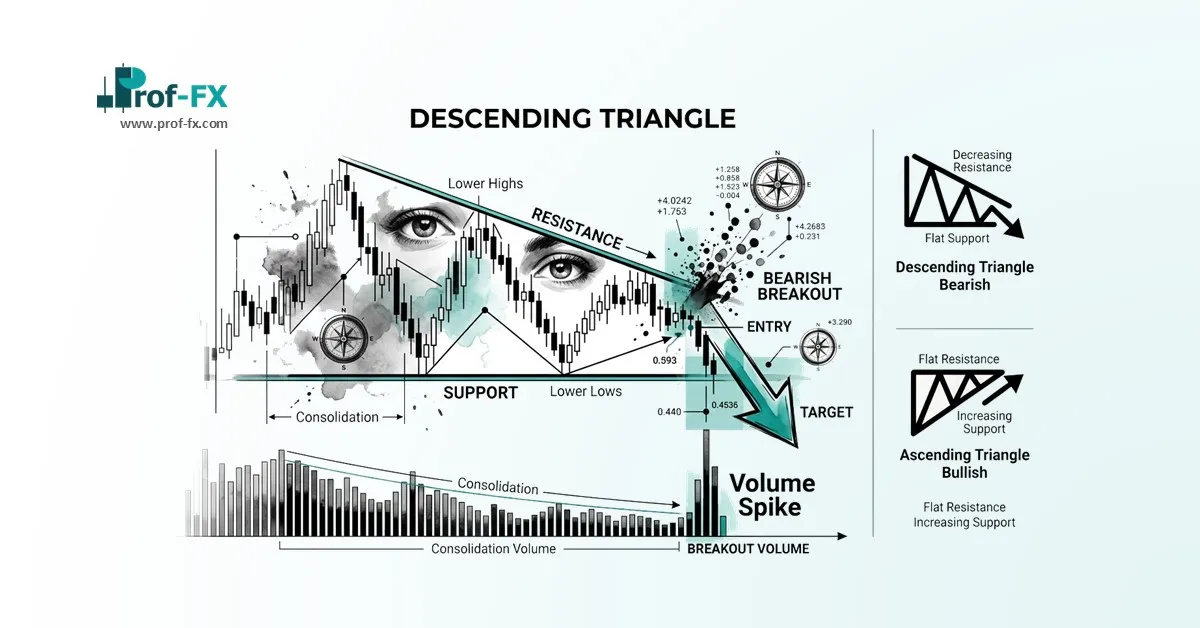
The descending triangle, also widely known as the falling triangle, is one of the most recognized bearish continuation patterns in technical analysis. It typically appears mid-trend during an existing downtrend, signaling that selling pressure remains dominant and that the market may continue lower after a temporary consolidation phase.
For professional forex traders, this pattern is highly valuable because it provides:
- a clear bearish bias
- objective breakout confirmation
- measurable take profit targets
- defined stop loss placement
This guide explains what the descending triangle is, how to identify it correctly, and how to trade it with precision.
What Is a Descending Triangle?
The descending triangle is a bearish chart pattern characterized by:
- a descending upper trendline
- a flat horizontal support line
This structure indicates that sellers are becoming increasingly aggressive, while buyers continue defending a fixed support zone.
The most important technical feature is that price forms a sequence of lower highs, showing that bullish attempts are weakening.
Eventually, the support level tends to break, confirming continuation of the larger bearish trend.
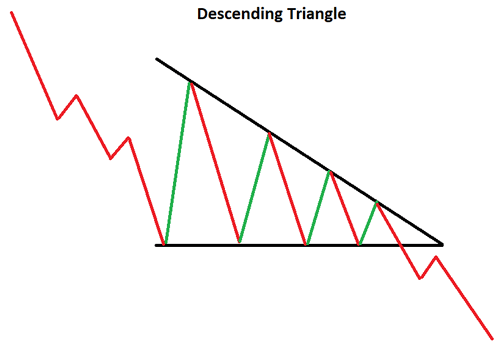
The pattern is considered complete only when price produces a decisive breakout below support.
From a professional perspective, this structure reflects a gradual transfer of control from buyers to sellers.
How to Identify a Descending Triangle Pattern on Forex Charts
The descending triangle is relatively easy to identify once traders understand the structure.
The following method can be applied not only in forex, but across stocks, indices, commodities, and other financial markets.
1. Confirm an Existing Downtrend
Before the pattern forms, the market must already be in a clear downtrend.
This is a critical requirement.
The descending triangle is a continuation pattern, which means it should not be traded in isolation.
Without a prior bearish trend, the pattern loses much of its statistical reliability.
This step helps ensure that the setup aligns with the broader market direction.
2. Identify the Consolidation Phase
After the initial bearish move, price begins to consolidate.
This is where the triangle starts to form.
During this phase, price movement becomes tighter and more compressed as the market pauses.
This consolidation reflects temporary indecision before the next directional move.
3. Draw the Descending Upper Trendline
Connect the sequence of lower swing highs to form the descending upper trendline.
This line slopes downward and visually confirms that sellers continue pushing price lower on every rally.
This is one of the strongest technical clues that bearish pressure remains intact.
4. Mark the Flat Support Line
The lower trendline is drawn horizontally across repeated lows.
This line acts as support.
Price often tests this zone multiple times before the eventual breakout occurs.
Repeated testing of support generally weakens the level over time.
5. Wait for Breakout Confirmation
The pattern is only confirmed after a strong bearish candle closes below support.
At this stage, traders look for continued downside momentum as confirmation that the downtrend is resuming.
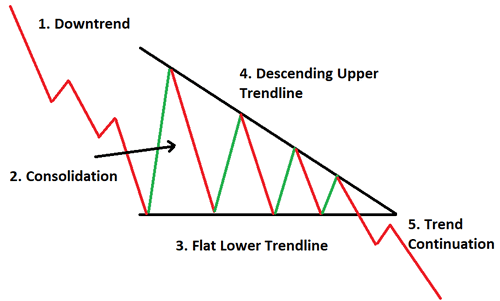
A breakout without follow-through should be treated cautiously, as false breakouts are possible.
Descending Triangle Measuring Technique
One of the strongest advantages of the descending triangle is that it includes a built-in price projection method.
This allows traders to estimate a logical take profit target.
The measuring process is straightforward:
- Measure the vertical distance from the highest point of the triangle to the flat support line
- Transfer that same distance downward from the breakout point
This projected distance creates a realistic bearish price target.
In technical terms:
- distance A to B
- is projected from C to D
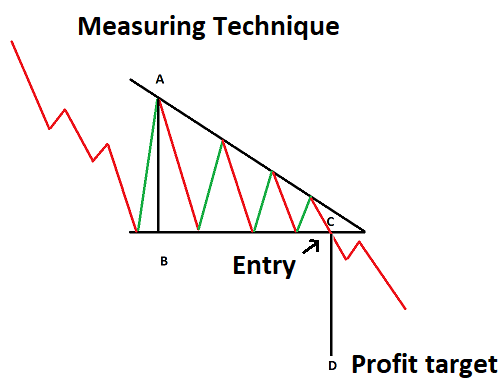
This method helps traders structure exits objectively rather than relying on guesswork.
From a professional risk management perspective, this is extremely valuable.
How to Trade the Descending Triangle
To trade the descending triangle effectively, traders must first confirm that the market is already trending lower.
For example, on an EUR/USD chart, price may initially show a clear bearish structure before entering consolidation.
As the candlesticks compress into the triangle formation, traders prepare for the breakout.
Once the triangle is fully formed, the measuring technique can be applied to establish a projected target.
After a strong breakout below support, traders may consider entering a short position.
A standard professional setup includes:
- entry: below confirmed support breakout
- stop loss: above the most recent swing high
- take profit: based on the measuring technique
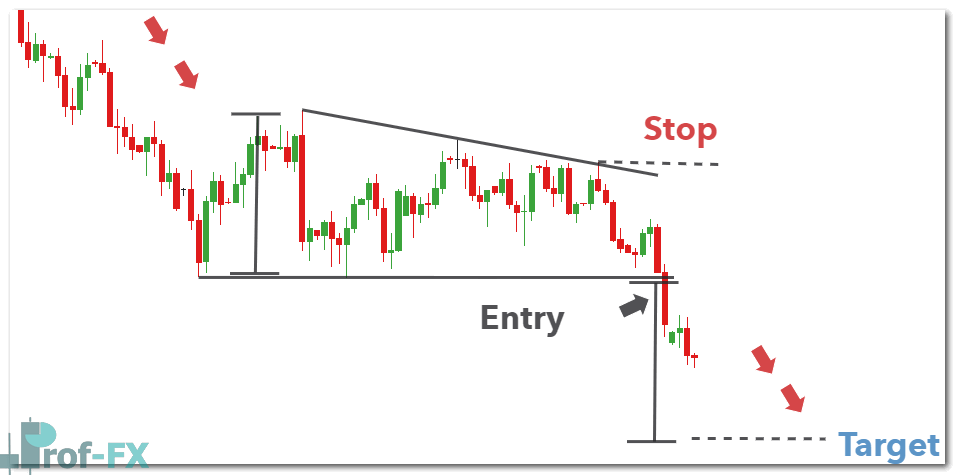
This structure creates a disciplined framework with defined risk and reward.
For better trade quality, many traders wait for a retest of broken support as new resistance before entering.
This can improve entry efficiency and reduce stop distance.
Advantages and Limitations of the Descending Triangle
Like all technical patterns, the descending triangle has both strengths and limitations.
Understanding both is essential for professional execution.
Advantages
- Easy to identify on most forex charts
- Provides a clear bearish continuation signal
- Includes an objective price target projection
- Offers defined entry, stop loss, and take profit levels
- Highly effective in trending markets
Limitations
- False breakouts can occur, especially during low-volume or volatile sessions
- Price may remain sideways for extended periods before breaking out
- In some cases, support may hold and price may reverse higher
- Requires strict risk management and confirmation
The most important conclusion is this:
the descending triangle should never be traded without confirmation and disciplined stop loss placement.
Even high-probability patterns can fail.
Trading Insight
The descending triangle is one of the most reliable continuation formations in bearish markets because it visually captures increasing seller dominance.
Repeated lower highs combined with horizontal support indicate that buyers are losing strength.
Once support breaks, momentum often accelerates.
For professional traders, the pattern is most effective when combined with:
- trend analysis
- volume confirmation
- candlestick breakout signals
- support and resistance mapping
- risk-to-reward ratio planning
This multi-layered confirmation significantly improves trade probability.
Further Reading on Forex Trading Patterns
The descending triangle remains one of the most important continuation patterns every forex trader should master.
It is also one of the three essential triangle patterns widely used in technical analysis.
For traders who are just beginning their journey, understanding these foundational price action structures is essential for building a robust trading strategy.
Prof FX continues to provide authoritative forex news and technical analysis on the trends shaping the global currency markets.