


An Introduction to Trend Trading
Among the primary market conditions, trends are often the most desirable for forex traders. This preference is driven by the presence of directional bias, which provides a structured framework for decision-making.
While the future of financial markets remains inherently uncertain, observable trends offer a logical basis for anticipating continued price movement. When a trend is supported by fundamental drivers such as central bank interest rate hikes, rising inflation, or shifts in macroeconomic expectations, it becomes more sustainable and tradable.
From a professional standpoint, trend trading is built on a simple but powerful principle:
Identify a strong directional move and align trades with that direction.
The well-known concept of “buy low, sell high” is often applied within trends by entering positions during temporary pullbacks in the direction of the prevailing move.
Defining a Trend: The Importance of Timeframes
One of the most common challenges in trend trading is the interpretation of trends across different timeframes.
A trend observed on a:
- 5-minute chart may contradict the direction on a
- 1-hour or daily chart
Similarly, a trend visible on the daily timeframe may differ from the broader direction seen on the weekly chart.
This creates a critical requirement:
We must evaluate trends consistently using predefined timeframes.
Without this alignment, trading decisions can become inconsistent and unreliable.
A widely accepted approach especially among swing traders is:
- Use the daily chart to identify the overall trend
- Use the 4-hour chart to refine entry points
This multi-timeframe analysis ensures that trades are aligned with the dominant market direction while optimizing timing for execution.
Defining a Trend: Methodologies
Once the timeframe is established, traders must apply a consistent method to identify and confirm trends. Several widely accepted techniques are used in professional trading.
1. Moving Averages
Moving averages are among the most commonly used tools for trend identification.
The 200-period moving average is particularly popular due to its ability to filter long-term trends. When price remains above this level, the market is generally considered bullish; when below, bearish.
However, this indicator has limitations:
- It reacts slowly to price changes
- In strong trends, price may remain far from the moving average for extended periods
- It may not provide timely entry signals
To address this, traders often use shorter-term moving averages such as:
- 20-period
- 50-period
- 100-period
These faster indicators respond more quickly to price movements, offering more actionable insights for trend trading.
EUR/USD with Multiple Moving Averages
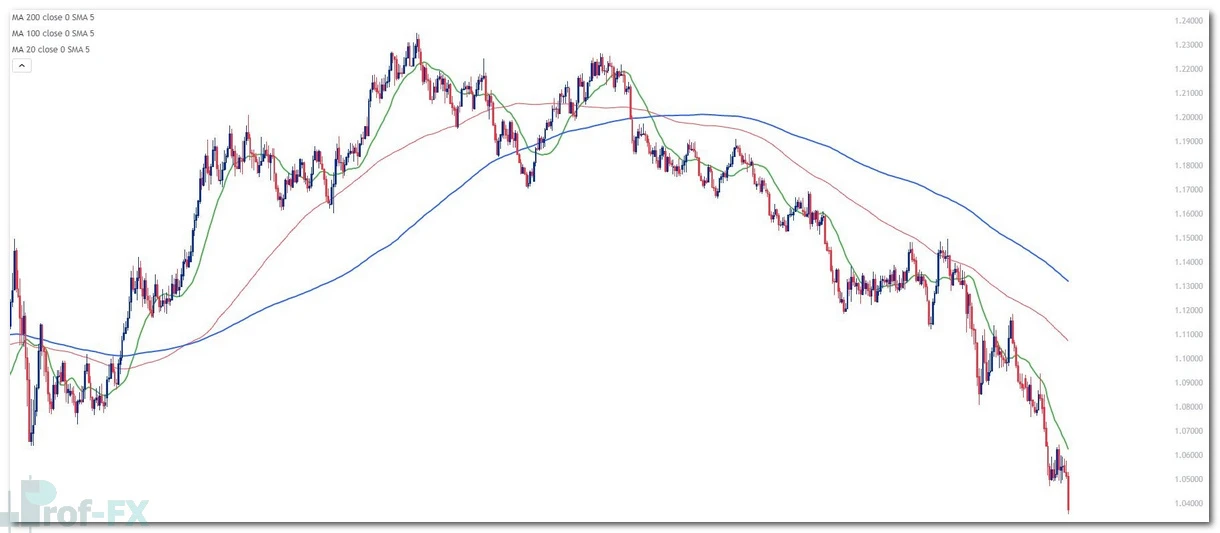
Shorter-period moving averages provide greater sensitivity, while longer-period averages offer stability and trend confirmation. Combining both allows for a more balanced analysis.
2. Moving Average Crossovers
Building on moving averages, traders often use crossovers to evaluate momentum and potential trend continuation.
A common example:
- 50-period moving average crossing above 200-period → Bullish signal (Golden Cross)
- 50-period moving average crossing below 200-period → Bearish signal (Death Cross)
These signals are widely recognized in both retail and institutional trading environments.
Their interpretation:
- Golden Cross: Indicates strengthening upward momentum
- Death Cross: Suggests increasing downward pressure
However, effectiveness depends heavily on market conditions:
- Strong trends → signals tend to perform well
- Sideways or choppy markets → signals may produce false entries
GBP/USD Chart with Golden and Death Crosses
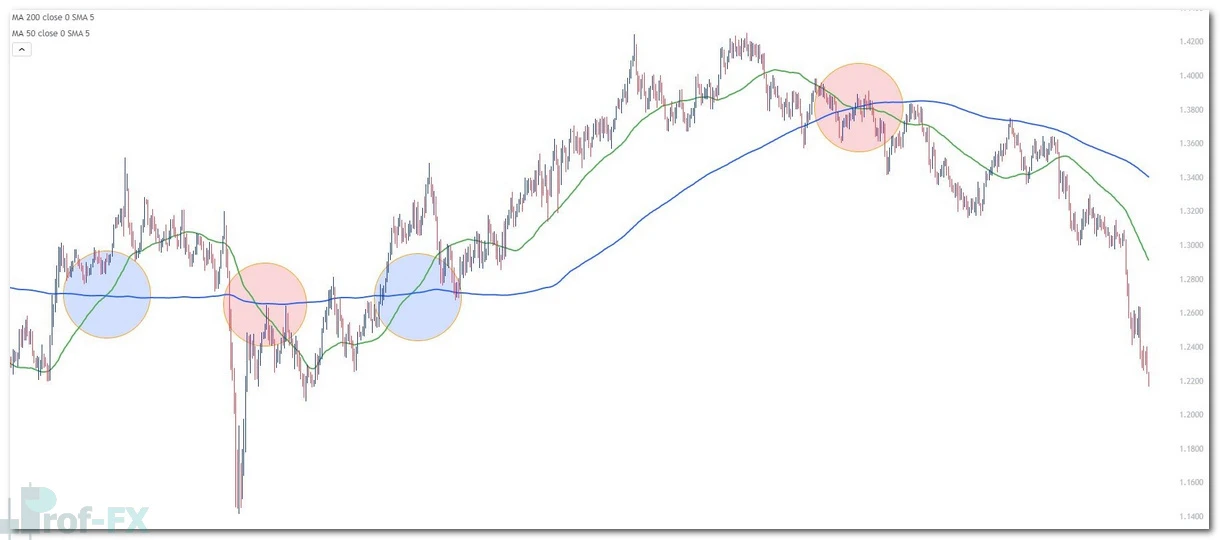
This highlights a critical insight:
Moving average crossovers are most reliable in trending environments and less effective in ranging markets.
3. Price Action Analysis
Price action remains one of the most fundamental and widely respected methods of identifying trends.
Unlike indicators, price action focuses directly on market structure:
- Uptrend: Series of higher highs and higher lows
- Downtrend: Series of lower lows and lower highs
This approach is more subjective but provides deeper insight into market behavior.
GBP/USD Daily Price Action Example
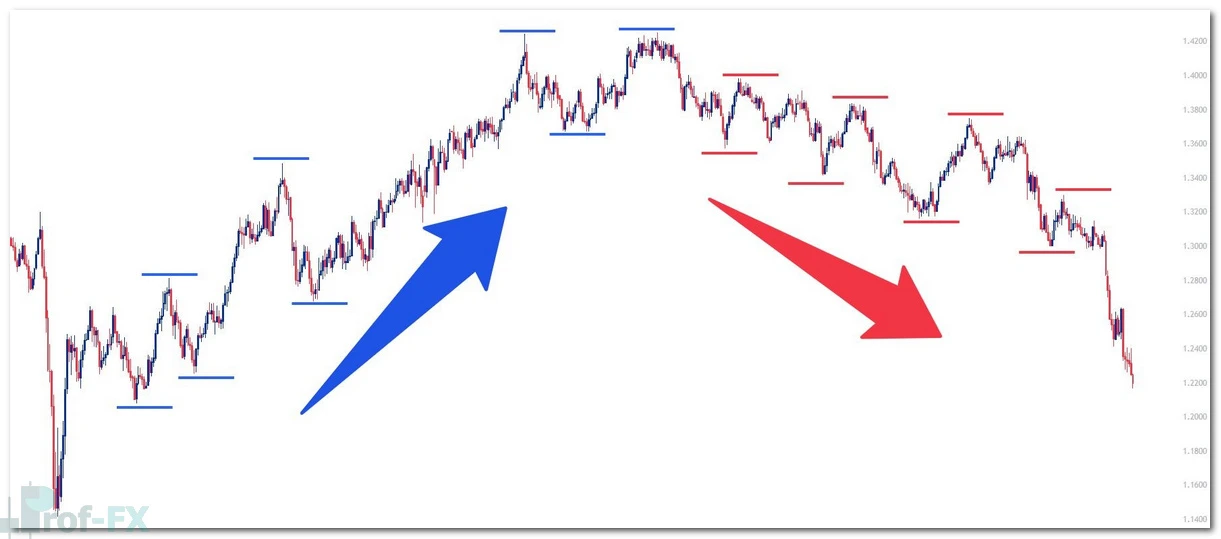
Professional traders often combine price action with indicators to strengthen their analysis. While indicators provide structure, price action reflects real-time market sentiment.
Conclusion: Building a Robust Trend Trading Strategy
Trend trading offers a structured and high-probability approach to navigating forex markets. By aligning trades with established market direction, we can take advantage of sustained price movements supported by both technical and fundamental factors.
A professional trend trading strategy requires:
- Clear timeframe alignment
- Reliable trend identification methods (moving averages, crossovers, price action)
- Strategic entry execution during pullbacks
- Strict risk management using stop loss and position sizing
Ultimately, success in trend trading depends on consistency, discipline, and the ability to adapt methodologies to evolving market conditions. Traders who master these principles gain a significant advantage in capturing long-term market opportunities.
Prof FX continues to provide expert forex insights and technical analysis to support traders in understanding and navigating global currency trends.


")


