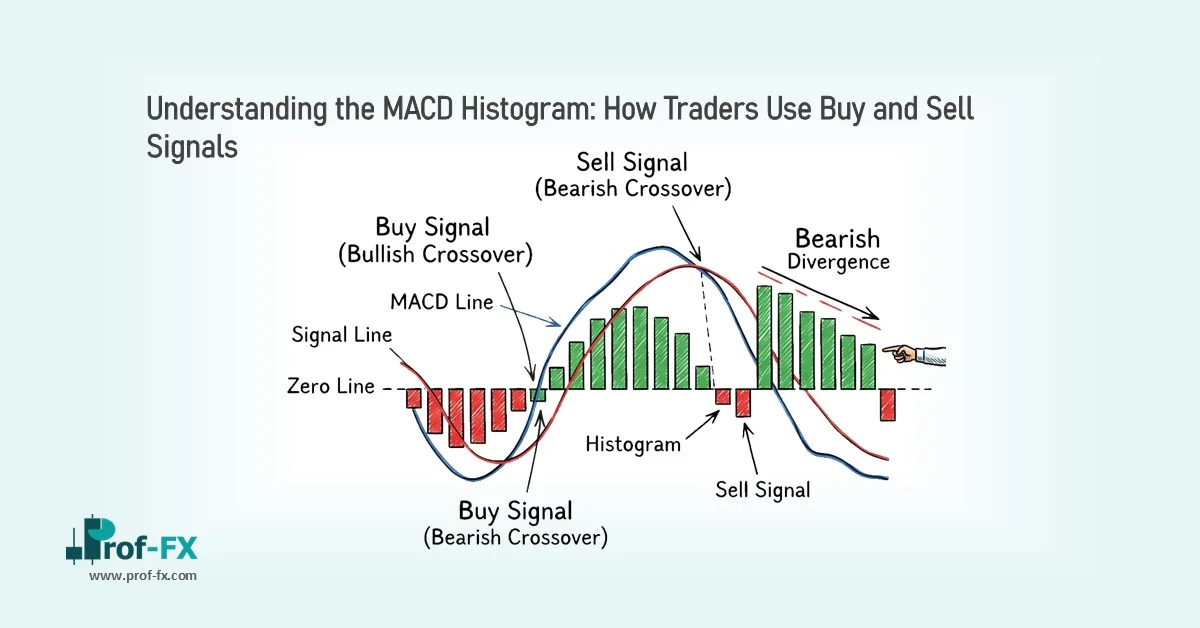
What is a Forex Entry Point?
A forex entry point refers to the specific price level at which a trader initiates a position either a buy or sell order in the market. Determining an optimal entry point is a critical component of trading, yet it remains complex due to the wide range of variables influencing currency price movements, including volatility, liquidity, and macroeconomic factors.
This article provides a structured overview of how to approach trade entries, focusing on three widely adopted strategies:
- Trend channels
- Breakouts
- Candlestick patterns
When is the Best Time to Enter a Forex Trade?
There is no universal “best” time to enter a forex trade. The optimal entry depends on the trader’s strategy, time horizon, and market conditions. Different trading styles such as scalping, day trading, or swing trading require different entry techniques.
The strategies outlined below represent some of the most commonly used and practical approaches. While not exhaustive, they provide a solid foundation for identifying high-probability entry points.
Forex Entry Strategy #1: Trend Channels
Trendlines are essential tools in technical analysis, used to define support and resistance levels within a trending market. When price consistently forms higher highs and higher lows, it indicates an uptrend. Conversely, lower highs and lower lows signal a downtrend.
In a clearly defined uptrend, traders typically establish a bullish bias looking to enter buy positions near support and target profits near resistance. This approach aligns with the principle of trading in the direction of the prevailing trend.
However, once price breaks through established support or resistance levels, traders must reassess market conditions. Such breaks may signal either a continuation (breakout) or a reversal, requiring a shift in strategy.
Forex entry strategy based on trend channels, weekly USD/ZAR chart:
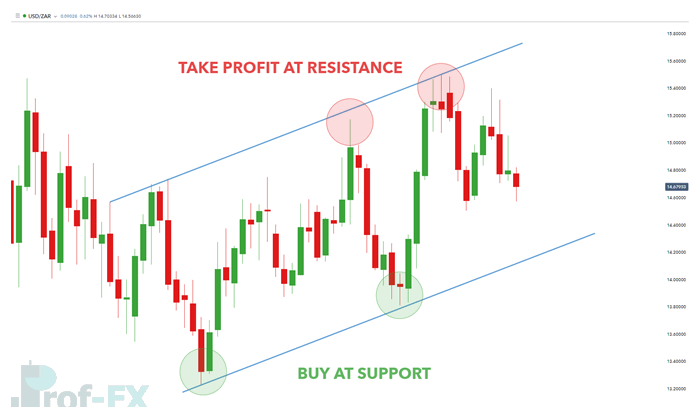
The key takeaway is that trend channels offer structured entry zones, but their effectiveness depends on correctly identifying whether the market remains within the trend or is transitioning into a new phase.
Forex Entry Strategy #2: Candlestick Patterns
Candlestick patterns are widely used by traders to identify potential reversal or continuation signals. Common formations such as engulfing patterns, shooting stars, and hammer candles provide visual insight into market sentiment.
In the example below, a hammer candlestick pattern appears on a EUR/USD chart. This formation typically signals a potential bullish reversal after a downtrend.
However, identifying the pattern alone is insufficient. A valid entry requires confirmation to reduce the probability of false signals. In this case, confirmation occurs when price closes above the high or close of the hammer candle, strengthening the bullish bias.
Hammer candlestick pattern trade entry, daily EUR/USD chart:
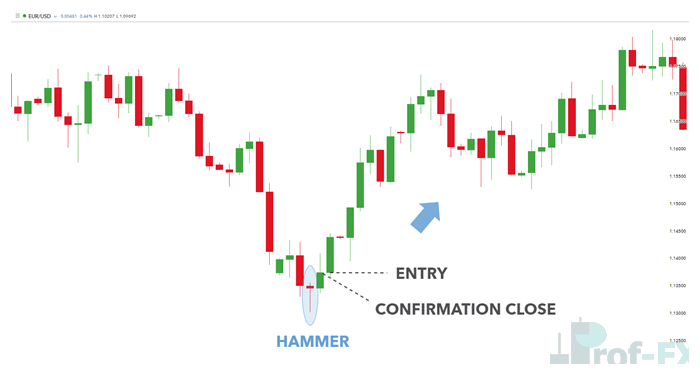
This confirmation-based approach enhances trade reliability. By waiting for additional validation, traders reduce risk exposure and improve the probability of successful outcomes.
In practice, traders often combine candlestick patterns with other tools such as indicators, price action analysis, or fundamental catalysts. While this article isolates each strategy for clarity, a multi-factor approach is generally more robust.
Forex Entry Strategy #3: Breakouts
Breakout trading is one of the most widely used methods for identifying entry points, particularly among beginner traders due to its straightforward structure.
This strategy involves identifying key support or resistance levels and entering trades when price breaks beyond these levels. A breakout suggests that new market information has been priced in, potentially leading to strong directional movement.
Successful breakout trading relies heavily on price action analysis. Traders must distinguish between genuine breakouts and false breakouts, which can occur in low-volume or uncertain market conditions.
In the example below, price breaks below a key support level (highlighted in red), accompanied by increased volume. This combination strengthens the validity of the breakout and signals a potential move lower. Entry is triggered either immediately upon the break or after a confirmation candle closes beyond the level.
Forex entry strategy based on breakouts, daily USD/JPY chart:
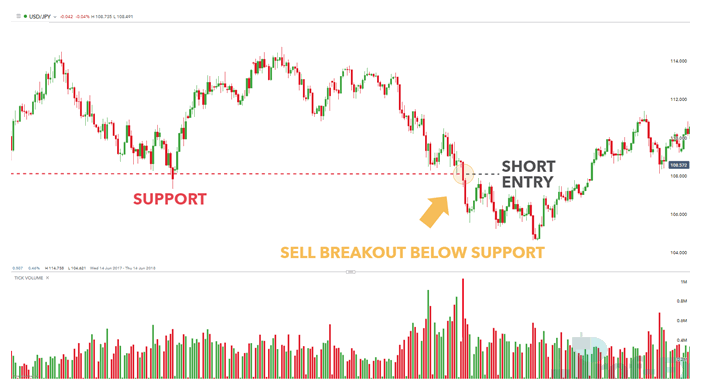
The simplicity of this method makes it accessible, but disciplined execution and confirmation remain essential to avoid premature entries.
Popular Forex Entry Indicators
Technical indicators are often used to support entry strategies by providing additional confirmation signals. Their effectiveness depends on alignment with the overall trading approach.
Below are some of the most widely used forex entry indicators:
| ENTRY INDICATOR | USE |
| RSI | Identifies overbought and oversold conditions; effective in both trending and range-bound markets. |
| Moving Average (MA) Crossover | Uses the interaction between short-term and long-term averages to generate entry signals. |
| MACD | Identifies momentum and trend direction through crossover signals, particularly effective in trending environments. |
These indicators are not standalone solutions but should be integrated into a broader analytical framework that includes price action and market structure.
Forex Entry Strategies: A Summary
Developing precise entry points requires both technical understanding and disciplined execution. The following principles reinforce a structured trading approach:
- Build a solid foundation in technical indicators and how they function within different market conditions
- Understand the distinction between technical and fundamental analysis, and how they complement each other
- Learn to recognize high-probability candlestick patterns and validate them with confirmation signals
- Apply strategies that align with current market conditions trend, range, or breakout
Ultimately, the effectiveness of any entry strategy depends on consistency, adaptability, and risk management. Traders who combine structured analysis with disciplined execution are better positioned to identify high-quality opportunities in the forex market.