


Understanding the Pin Bar in Price Action Trading
One of the most compelling entry triggers in price action trading is the Pin Bar. This single-candlestick formation provides valuable insight into market sentiment and potential reversals, making it a popular candlestick pattern among technical traders.
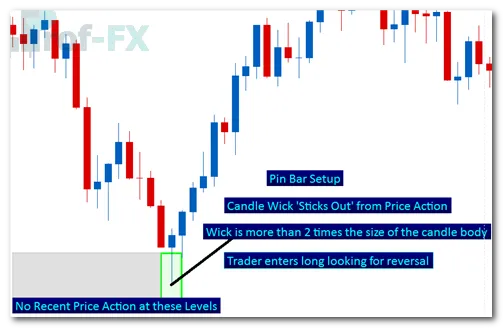
The term Pin Bar is derived from “Pinocchio Bar”, referring to its most distinctive feature—an elongated wick that protrudes sharply from surrounding price action. Typically, traders look for pin bars where the wick is at least twice the size of the candle’s real body, signaling strong rejection of a particular price level.
When price attempts to move in one direction but is aggressively rejected, it leaves behind this long wick. Traders often interpret this rejection as a clue that momentum may reverse in the opposite direction.
- A long lower wick suggests buyers stepped in aggressively → potential bullish reversal
- A long upper wick suggests sellers overwhelmed buyers → potential bearish reversal
Why the Pin Bar “Tells a Lie”
Much like Pinocchio’s nose, the long wick of a pin bar can signal that the market briefly “lied” about direction. Price attempted to move beyond a level, but that move was rejected before the candle closed.
However, an important reality for traders to understand is this:
Not every long wick is a true Pin Bar.
Many candlesticks may look like pin bars at first glance, but fail to meet the structural criteria. These are known as Fake Pin Bars, and trading them requires a different approach.
Pin Bar vs Fake Pin Bar: What’s the Difference?
The key distinction between a genuine Pin Bar and a Fake Pin Bar lies in recent price structure.
A Genuine Pin Bar
A pin bar is considered valid when:
- The long wick clearly sticks out beyond recent highs or lows
- Price tests a previously untested level
- The wick represents a strong rejection from that level
This “stick-out” effect suggests that a new group of buyers or sellers entered the market aggressively.
A Fake Pin Bar
A fake pin bar occurs when:
- The wick does not extend beyond recent price action
- The candle forms within congestion or structure
- Price rejection is weaker or less meaningful
In this case, the candle does not represent a fresh rejection of new territory, but rather a reaction within existing market structure.
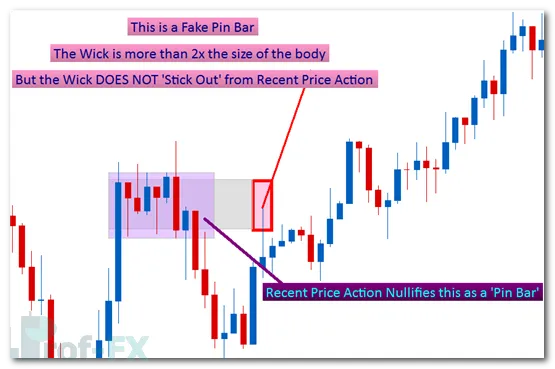
As shown above, the fake pin bar fails to clearly stand out from prior price action, making the reversal signal far less reliable if traded blindly.
Why Trading Fake Pin Bars Is More Challenging
With a genuine bearish pin bar—where a long upper wick sticks out—traders might reasonably look to enter short positions. However, applying the same logic to a fake pin bar can lead to poor results.
This is because fake pin bars do not consistently signal strong reversals on their own. Trading them effectively requires additional context and confirmation, rather than relying on the candle shape alone.
How to Trade Fake Pin Bars the Right Way
Before trading either pin bars or fake pin bars, traders must understand what they are actually trying to participate in—momentum, trend continuation, or rejection at key levels.
Let’s first revisit what makes a legitimate pin bar attractive.
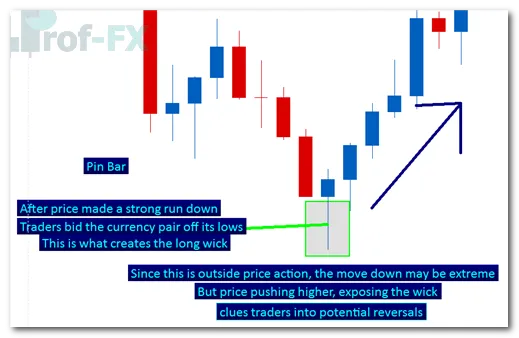
In the example above, price reversed sharply during the candle’s lifespan, leaving a long wick beneath price action. This shows strong rejection and clear buyer dominance.
But what happens when the wick does not sit outside recent price action?
Using Fake Pin Bars as Trend-Continuation Signals
A fake pin bar may indicate a temporary pullback, rather than a full reversal. As such, fake pin bars tend to perform best when traded in the direction of the dominant trend.
This is a critical distinction.
Instead of attempting to fade the market, traders can:
- Identify the long-term trend
- Use the fake pin bar as a timing tool
- Enter in the direction of trend continuation
To do this effectively, traders must zoom out on the chart and analyze broader price structure—more so than they would with a genuine pin bar.
Trend Qualification Using Price Action
Traders can define trends using classic price action principles:
- Uptrend: Higher highs and higher lows
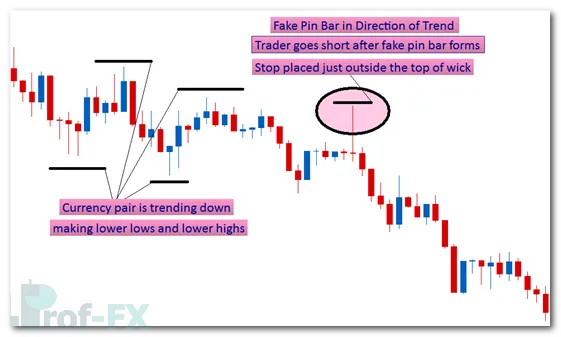
- Downtrend: Lower highs and lower lows
Once the trend is identified, fake pin bars can be used as confirmation of rejection against the trend, rather than signals to trade against it.
The image below illustrates a bullish fake pin bar within an established uptrend.
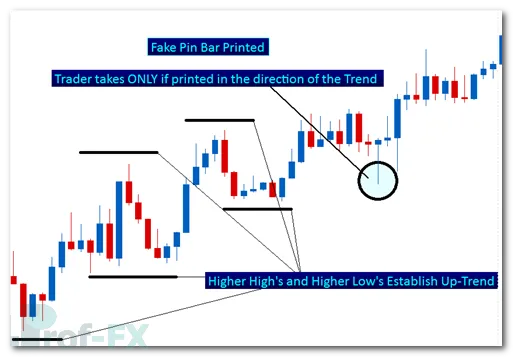
In this example:
- Price is making higher highs and higher lows
- A sudden bearish push occurs
- Sellers fail to maintain control before candle close
- A long wick forms, but remains within structure
This signals failed bearish momentum, not a reversal.
Trade Execution and Risk Management
Traders may consider:
- Entering long after the fake pin bar candle closes
- Placing a stop-loss just below the wick’s low
This stop placement ensures that if price breaks below the wick, the setup is invalidated—protecting capital if the market moves against the position.
This approach aligns the trade with:
- The prevailing trend
- Institutional price behavior
- Logical market structure
Key Takeaways for Price Action Traders
For traders learning price action, the most important lessons are:
- Not all long wicks are true pin bars
- Fake pin bars are context-dependent
- Trend alignment significantly improves probability
- Fake pin bars often signal continuation, not reversal
- Risk management is more important than candle shape
Understanding how to trade fake pin bars properly allows traders to avoid false signals and extract value from price behavior that others may misinterpret.


