


Understanding whether a trend is gaining momentum—or quietly losing steam—is one of the most important skills any forex trader can develop. Entering a trend that is already fading is not only frustrating but can also lead to unnecessary drawdowns. Many traders rely on technical setups for trend entries, yet without confirming the strength behind a trend, even the best entry pattern becomes ineffective.
One of the most reliable tools to measure trend strength is the Average Directional Index (ADX). When combined with your existing trend-entry strategy, ADX can help you trade breakouts, pullbacks, and continuation moves with significantly higher probability.
Why ADX Matters: Quantifying Strength Behind Price Movements
The ADX does not predict direction. Instead, it qualifies and quantifies the strength of a trend, regardless of whether the price is rising or falling. This makes it especially valuable for traders using trend-following methods such as:
- Breakout strategies
- Pullback entries
- Momentum trading
- Swing trading within major pairs like EURUSD, GBPJPY, and USDJPY
By focusing purely on trend strength, ADX allows traders to stay aligned with trends that exhibit real participation – typically driven by institutional flows, macroeconomic catalysts, or strong risk sentiment shifts in the forex market.
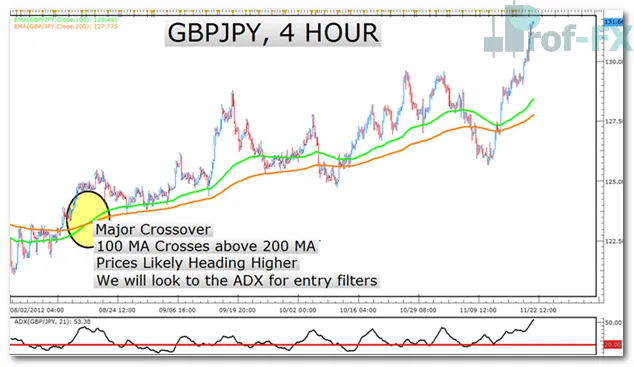
In the example of GBPJPY, the chart illustrates a healthy uptrend supported by multiple viable entry points. The ADX reading stays predominantly above the key threshold, confirming strong bullish momentum. The added red line helps traders visually identify when the indicator crosses into a strong-trend zone.
Filtering Trends Using ADX: The 25-Level Rule
To filter trend strength effectively, most professional traders rely on a simple benchmark:
ADX Above 25 = Strong Trend Environment
When ADX rises above 25, it indicates increasing trend momentum. Conversely, when ADX drops below 25, the trend is weakening or entering consolidation.
How to Interpret ADX Values
| ADX Value | Trend Condition |
| 0–20 | Weak / No Trend |
| 20–25 | Potential Trend Forming |
| 25–40 | Strong Trend |
| 40+ | Very Strong Trend (use caution for exhaustion) |
Remember, ADX behaves like the RPM gauge in a car—it measures power, not direction. You still need complementary indicators to determine directional bias.
Adding Directional Bias: Pairing ADX With Other Indicators
Since ADX doesn’t identify direction, traders often combine it with tools such as:
- Fibonacci Retracements
- Slow Stochastic (Stochastics)
- Moving Averages (20 EMA, 50 SMA, etc.)
- Price Action patterns (breakouts, engulfing candles, retests)
By merging ADX with these tools, you’re effectively filtering out low-quality setups and focusing only on trades aligned with a strengthening trend—a core principle of high-probability trading.
How to Enter Strong Trends Using ADX
A foundational rule in professional trading is this:
You can control risk, but you cannot control the market.
Therefore, every position you take must have a justifiable probability of success.
This is where ADX becomes a valuable filter. Before entering a potential downtrend or uptrend, the ADX must confirm that the trend has actual strength behind it.
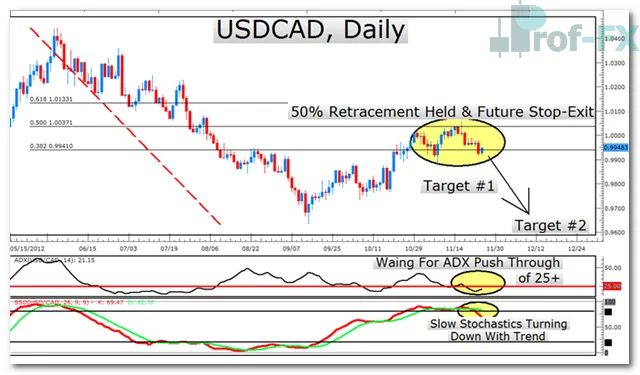
Here’s a real-world example from the USDCAD, where the chart suggests the potential beginning of a strong downward move.
Indicators Used in This Setup
- ADX — to confirm trend strength
- Fibonacci Retracement — to identify pullback levels
- Slow Stochastic (SSD) — to validate momentum turning back downward
Before entering any trade, the first priority is to watch the ADX push through the 25-level. When that happens, the indicator is effectively giving the “green light” to act in the direction of the dominant trend. In this scenario, the broader USDCAD daily trend is downward.
Since ADX has not yet confirmed strength, traders must remain patient and wait for the setup to mature. Discipline at this stage is what separates professional traders from impulsive ones.
Applying Fibonacci Retracements to Identify Pullbacks
Fibonacci retracements help traders identify potential support/resistance zones, especially during counter-trend corrections. In a downtrend, prices often retrace to one of the key Fib levels—especially the 38.2%, 50%, and 61.8% levels—before continuing downward.
The 50% retracement, one of traders’ favorites, is key here. The principle states:
If the market can hold above or below the 50% level after a corrective move, the overall trend has a strong chance of resuming.
In the chart, the market respects the 50% level and begins to push lower. If ADX breaks above 25, it confirms the renewed strength of the downtrend.
Using Slow Stochastic to Time Entries
The Slow Stochastic Oscillator (SSD) helps refine entry timing by identifying overbought and oversold conditions:
- Above 80 = Overbought
- Below 20 = Oversold
During a downtrend, prices typically close near their lows. A high-probability entry occurs when the stochastic turns down from above 80, signaling that the counter-trend pullback is losing steam.
This alignment between momentum exhaustion (SSD), structural levels (Fibonacci), and trend strength (ADX) forms a powerful, rule-based trading system.
Why ADX Enhances Any Trading System
The ADX is flexible and integrates seamlessly into nearly any strategy. It helps traders:
- Avoid choppy, low-momentum markets
- Stay aligned with strong institutional trends
- Increase confidence in both breakout and pullback entries
- Allow profits to run during strong momentum phases
- Apply better risk management based on trend strength
By quantifying trend strength, ADX ensures that every trade you take aligns with your money management rules and your strategic edge.
Final Thoughts: Let ADX Confirm the Trend Before You Commit
The ADX indicator helps traders filter out low-quality setups and focus only on strong, sustainable trends. Whether you’re trading major currency pairs, minor pairs, or cross-pairs, ADX provides a consistent and objective way to evaluate momentum in the forex market.
When used alongside your preferred tools—such as Fibonacci, Stochastics, or price action—ADX becomes a power tool that strengthens your decision-making process and keeps you on the right side of market momentum.
Happy Trading.


