


Why Traders Focus on Market Inflection Points
Traders who aim to trade market turning points, such as swing highs and swing lows, usually do so with a clear objective:
to align their entries, exits, and risk management with natural shifts in market structure.
These turning points—often referred to as market inflection points—occur repeatedly across nearly every currency pair and timeframe. They represent moments when price temporarily changes direction before resuming its broader move.
Understanding where these inflection points form can significantly improve:
- Trend analysis
- Trade timing
- Stop-loss placement
- Overall trade management
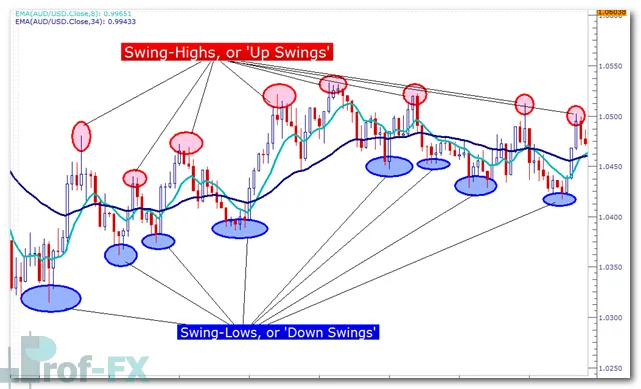
How Price Naturally Forms Swings
Markets rarely move cleanly in one uninterrupted direction. Instead, price progresses through a sequence of swings driven by profit-taking, new participation, and shifts in short-term sentiment.
In a downtrend, price typically produces:
- Stronger and deeper down-swings
- Smaller and weaker up-swings
In contrast, an uptrend often displays:
- Repeated swing lows
- Each swing low forming at progressively higher price levels
This stair-step behavior reflects sustained buying pressure, even as short-term pullbacks occur.
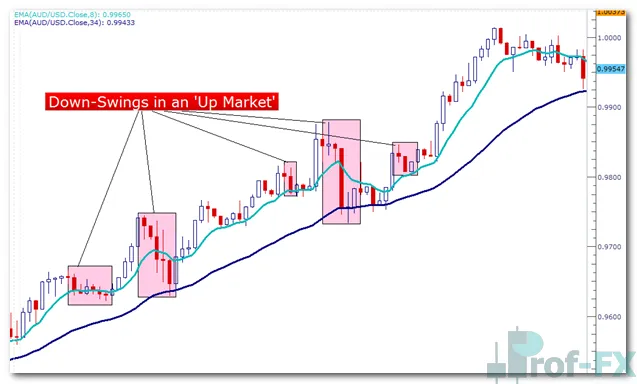
These swing dynamics are the foundation of price action analysis, and recognizing them helps traders avoid fighting the dominant market direction.
Swings in the Context of Price Action Trading
In earlier articles within this price action series, we explored how traders can:
- Identify trends using higher highs and higher lows
- Enter trades using price-based signals
- Manage open positions without relying on indicators
All of these techniques rely, directly or indirectly, on accurate identification of market swings.
Because swings represent key structural points on the chart, traders often seek tools that can help highlight these levels more clearly—especially when markets become volatile or complex.
This is where the Fractal indicator becomes particularly useful.
What Is a Fractal Indicator?
Fractals are a technical indicator designed to identify swing highs and swing lows automatically.
Rather than predicting future price movement, fractals simply mark historical inflection points, making it easier for traders to visualize market structure.
In essence, fractals act as a visual assistant, pointing out where price has previously:
- Failed to move higher
- Failed to move lower
How Up Fractals Identify Swing Highs
An Up Fractal appears on a candle when:
- The candle to the left has a lower high
- The candle to the right also has a lower high
This structure highlights a local peak, where buying pressure was unable to push price higher.
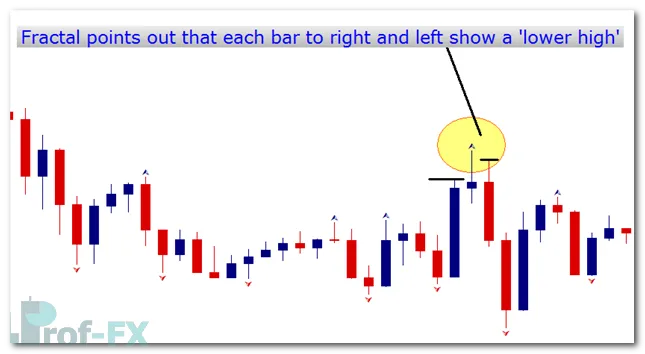
Up fractals are often used by traders to:
- Identify potential resistance levels
- Mark swing highs in downtrends or ranges
- Assist with trailing stop placement on short positions
How Down Fractals Identify Swing Lows
A Down Fractal is formed when:
- The candle before has a higher low
- The candle after also has a higher low
This pattern identifies a local trough, signaling rejection of lower prices.
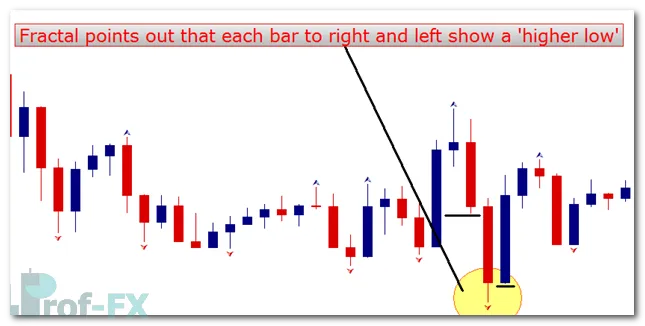
Down fractals are commonly used to:
- Identify support zones
- Mark swing lows in uptrends
- Assist with stop-loss placement for long positions
Why Fractals Matter for Forex Traders
Fractals do not replace price action analysis—but they enhance it.
When combined with:
- Trend structure
- Support and resistance
- Candlestick behavior
- Market context
Fractals help traders:
- See swings more objectively
- Reduce emotional bias
- Maintain consistency in analysis across timeframes
This makes them especially valuable for forex traders, where price movement is continuous and highly liquid.
Key Takeaway for Traders
Fractals are best viewed as a structural guide, not a standalone trading system. They highlight where price has already reacted, allowing traders to make more informed decisions about trend direction, trade entries, and risk management.
As with all price action tools, their effectiveness improves when used in context, rather than in isolation.


