Overview: Why Diagonal Patterns Matter in Forex Trading
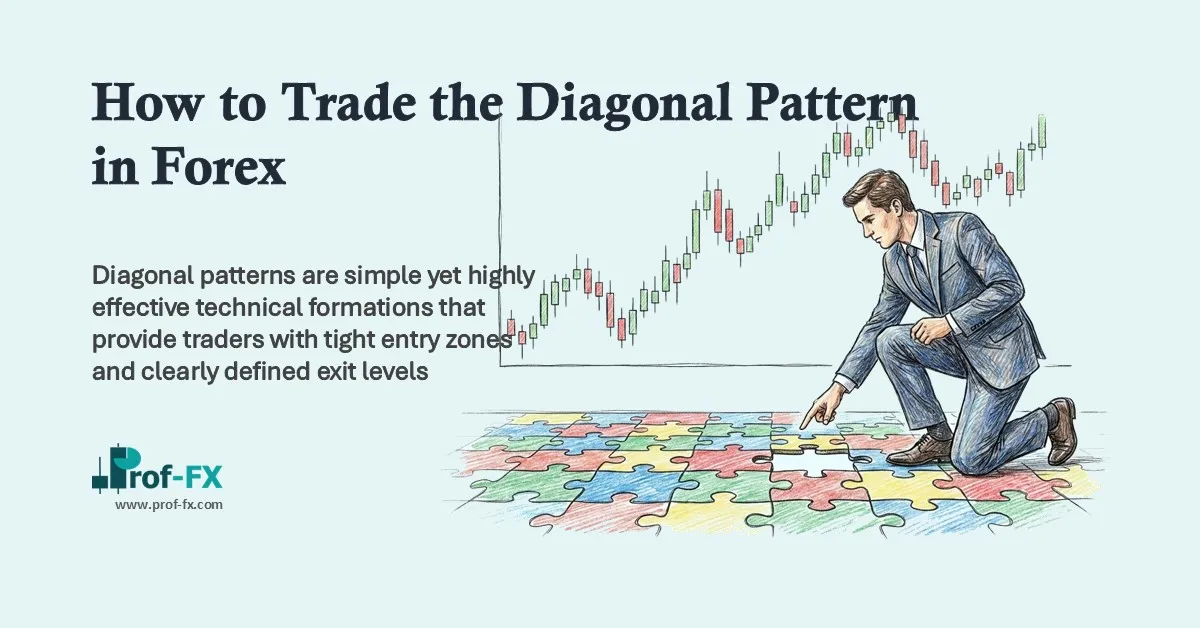
Diagonal patterns are simple yet highly effective technical formations that provide traders with tight entry zones and clearly defined exit levels. In many cases, the risk-to-reward ratio offered by diagonal patterns can be significantly better than the standard 1:2 ratio commonly taught in most forex trading courses.
This is one of the reasons diagonal patterns are favored by many professional traders. The structure is straightforward, the rules are clear, and the risk parameters are easy to define. In this guide, we will focus specifically on the bullish diagonal pattern, explaining how to identify it and how to structure entries, stop losses, and profit targets.
Understanding the Anatomy of a Bullish Diagonal
A textbook bullish diagonal consists of five distinct price waves. These waves unfold in a controlled, contracting manner, signaling that bearish momentum is gradually weakening.
In an ideal bullish diagonal:
- Waves 1, 3, and 5 are the impulsive moves in the direction of the prevailing trend
- Each successive impulsive wave is smaller than the previous one
- Wave 5 is shorter than wave 3
- Wave 3 is shorter than wave 1
This contraction in wave length is a critical clue. It indicates that sellers are losing strength and that downside momentum is fading.
When you connect:
- Waves 2 and 4 with a trend line
- Waves 1 and 3 with another trend line
You will notice a narrowing, triangular structure forming. This converging price action creates the foundation of the bullish diagonal pattern.
Why Diagonal Patterns Often Trap Trend Traders
At first glance, diagonal patterns can be misleading. Price continues to print lower highs and lower lows, which typically signals a bearish trend. As a result, trend-following traders may continue selling into what appears to be a strong downtrend.
However, beneath the surface, there are subtle signs that the trend is approaching exhaustion. Two important clues help identify this shift in momentum.
Key Clues That Signal a Fading Trend
Measuring the Wave Lengths
One of the most reliable ways to identify a diagonal is by measuring the size of each impulsive wave. When:
- Wave 5 is shorter than wave 3
- Wave 3 is shorter than wave 1
It suggests that each new push lower is traveling less distance than the previous one. This loss of momentum implies that sellers are becoming less aggressive and that the move may be nearing completion.
Watching for Indicator Divergence
Another powerful confirmation tool is simple indicator divergence, commonly observed using oscillators such as RSI. If price makes a lower low during wave 5 but the oscillator fails to confirm that lower low, it indicates that bearish momentum is weakening.
Divergence does not guarantee a reversal on its own, but when combined with a diagonal pattern, it significantly increases the probability of an upward correction or trend reversal.
Diagonal vs Triangle: Knowing the Difference
It is important not to confuse a diagonal with a triangle pattern. While both may appear similar visually, their behavior is quite different.
- Triangles tend to consolidate price sideways after a prior move
- Diagonals remain directional
In a diagonal pattern, both trend lines slope in the same direction, either upward or downward. In contrast, a triangle typically shows one trend line sloping up and the other sloping down.
This directional alignment is a defining characteristic of diagonal patterns.
Bullish Ending Diagonal: EUR/USD Example
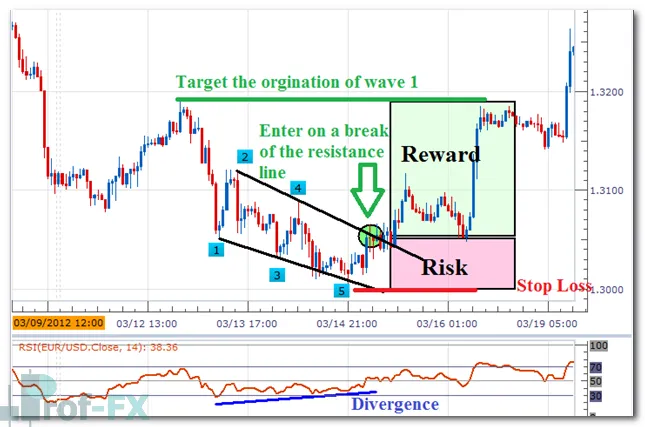
In the example above, EUR/USD is approaching the end of an extended move to the downside. Price continues to produce lower highs and lower lows, which may appear bearish on the surface.
However, closer inspection reveals that:
- Wave 5 is shorter than wave 3
- Wave 3 is shorter than wave 1
- RSI is showing clear divergence
These factors together signal that downside momentum is fading and that the market may be preparing for a corrective move higher.
How to Trade the Bullish Diagonal Pattern
As wave 5 begins to form—or shortly after it completes—traders can start preparing for a potential trade setup.
The execution rules are straightforward:
Step 1: Draw the Resistance Trend Line
Connect the highs of wave 2 and wave 4. This trend line acts as dynamic resistance.
Step 2: Enter on the Break
Enter a long (buy) position when price breaks above this trend line. This breakout strongly suggests that the low of wave 5 is already in place.
Step 3: Place the Stop Loss
Position the stop loss just below the swing low of wave 5. If price breaks below this level, the diagonal structure is invalidated.
Step 4: Set the Profit Target
Place the take-profit order near the start of wave 1, which often acts as a logical target for the corrective move.
Because the pattern reflects exhausted selling pressure, once price turns bullish, the move higher can be fast and aggressive.
Risk-to-Reward Advantage of Diagonal Patterns
In many cases, bullish diagonal setups can offer risk-to-reward ratios of 1:3 or better. This is significantly more favorable than the 1:1 ratios discussed in Prof FX research on the traits of successful traders.
Higher reward potential relative to risk allows traders to remain profitable even with modest win rates, provided they execute the strategy consistently.
Risk Management Considerations
It is important to remember that no pattern works 100% of the time. Diagonal patterns are simply structured setups with defined rules—not guarantees of success.
Responsible traders protect their capital by:
- Trading smaller position sizes
- Limiting total exposure across open trades
- Risking less than 5% of account equity across all positions
Sound risk management ensures that a series of losing trades does not jeopardize long-term trading performance.
Final Thoughts on Trading Diagonal Patterns
Bullish diagonal patterns provide traders with a powerful way to anticipate trend exhaustion and capitalize on corrective market moves. By combining price structure, wave measurement, and momentum divergence, traders can identify high-probability setups with clearly defined risk.
When traded with discipline and proper risk management, diagonal patterns can become a valuable addition to any forex trader’s technical toolkit.
Good luck, and trade safely.