


Floor-Trader Pivots are a classic and highly respected technical tool used by professional traders to identify potential price reaction zones. These pivot levels help traders anticipate where price is likely to pause, reverse, or accelerate—making them especially useful for target setting and risk management.
While there are several types of pivot point calculations, Floor-Trader Pivots—also known as Classical Pivot Points—remain one of the most widely used due to their simplicity and strong foundation in support and resistance analysis, a core principle of technical trading across all financial markets.
What You’ll Learn in This Guide
In this article, we will cover:
- The definition and origin of Floor-Trader Pivots
- How Floor-Trader Pivots are calculated
- Practical ways to trade using Floor-Trader Pivot levels
What Are Floor-Trader Pivots?
Floor-Trader Pivots are predefined support and resistance levels calculated using historical price data. These levels consist of:
- A central Pivot Point
- Three resistance levels (R1, R2, R3)
- Three support levels (S1, S2, S3)
The calculation uses the previous period’s high, low, and close, projecting future price levels where the market is statistically likely to react.
The term “Floor-Trader Pivots” originates from the era before electronic trading, when institutional traders operated on exchange floors. These traders relied on quick, objective calculations to determine whether price was relatively cheap or expensive before executing trades.
Today, modern traders can easily apply this same methodology using pivot point indicators available on most professional charting platforms.
How to Calculate Floor-Trader Pivot Points
Floor-Trader Pivots can be calculated on daily, weekly, or monthly timeframes, depending on the trader’s strategy and holding period.
Central Pivot Point Formula
Pivot Point (P)
(Previous High + Previous Low + Previous Close) ÷ 3
Directional Bias Based on Price Location
| Price Relative to Pivot | Market Bias |
| Price above pivot | Bullish bias |
| Price below pivot | Bearish bias |
Resistance Levels
- R1 = (Pivot × 2) − Previous Low
- R2 = Pivot + (R1 − S1)
- R3 = Pivot + (R2 − S2)
Support Levels
- S1 = (Pivot × 2) − Previous High
- S2 = Pivot − (R1 − S1)
- S3 = Pivot − (R2 − S2)
Many traders rely on online calculators to generate these values. To simplify this process, Prof FX provides an automated Pivot Points table, displaying Classical, Camarilla, and Woodie pivots across hourly, daily, weekly, and monthly timeframes for major markets.
How to Trade Using Floor-Trader Pivots
Floor-Trader Pivots are most effective when used as part of a structured trading plan. Below are three practical ways traders incorporate them into real-world trading.
1. Trade in the Direction of the Trend
In strong trending markets, traders tend to capture larger price movements by trading with the dominant trend, rather than attempting countertrend reversals.
During a well-established downtrend, pivot support levels (such as S1 and S2) often act as dynamic resistance after price breaks below them. Traders may look for:
- Breakout continuation trades
- Short entries a few pips below pivot resistance
NZD/USD Daily Chart Using Floor-Trader Pivots
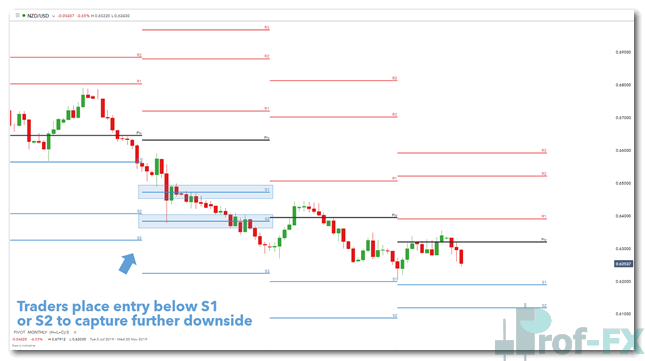
In the example above, S1 and S2 repeatedly cap price rallies, reinforcing bearish momentum and offering structured short-entry zones.
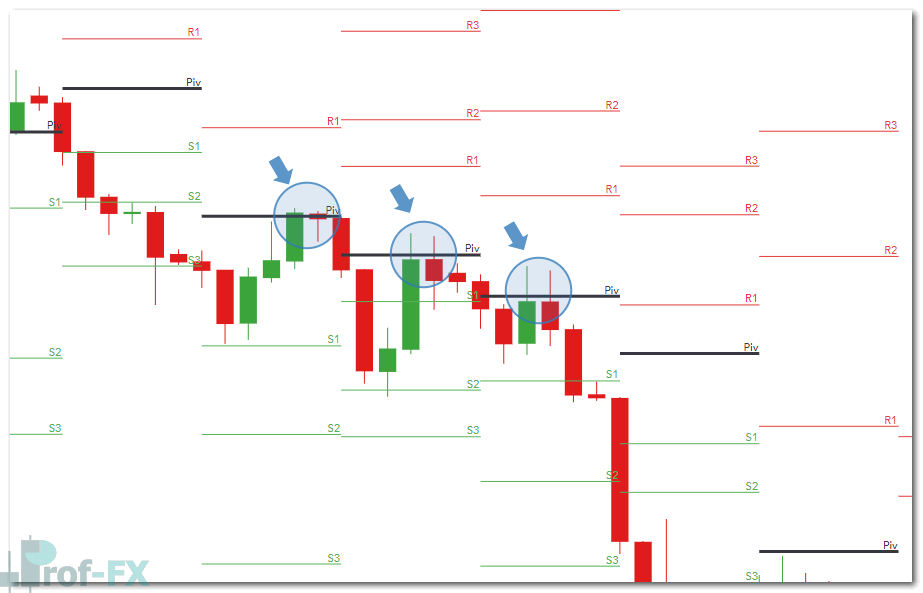
2. Using Pivot Points for Pullback Entries
Classical pivots are also effective for pullback-based entries within a trend.
In a downtrend, price often retraces upward toward the central pivot before resuming lower. Traders can:
- Place pending sell orders near the pivot
- Wait for bearish price action confirmation before entering
This approach allows traders to enter at more favorable prices while maintaining alignment with trend direction.
GBP/USD Daily Chart Showing Pivot Pullback Entry
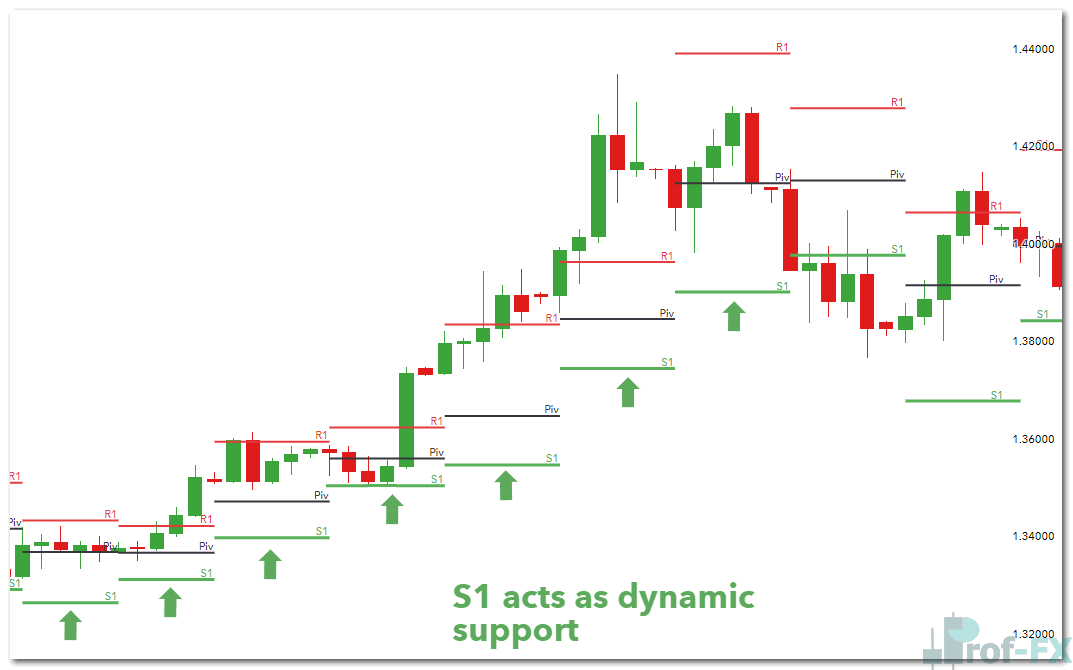
3. Floor-Trader Pivots as Dynamic Support and Stops
Another powerful application of Floor-Trader Pivots is using them as dynamic support, resistance, or trailing stop levels.
As price trends higher, support levels such as S1 will gradually rise. Traders can trail stop-loss orders just below these levels to:
- Protect unrealized profits
- Exit positions if market momentum reverses
In more volatile conditions, wider stops aligned with S2 or S3 may be appropriate—provided position size is adjusted accordingly.
GBP/USD Chart Demonstrating Dynamic Pivot Stops
Why Floor-Trader Pivots Remain Relevant
Despite advances in algorithmic trading and complex indicators, Floor-Trader Pivots remain widely followed because:
- They are objective and rule-based
- Many institutional and retail traders watch the same levels
- They reinforce core market structure through support and resistance
This collective awareness often increases the likelihood of price reacting near pivot levels.
Learn More About Pivot Point Trading
To expand your understanding of pivot-based strategies, consider exploring:
- Pivot Point Strategies for Forex Traders
- Automated tables for Classical, Camarilla, and Woodie Pivots
- A deeper dive into Support and Resistance Trading Concepts
All of these tools help traders build higher-probability trade setups grounded in market structure rather than guesswork.
Prof FX provides ongoing forex news, macroeconomic insights, and professional technical analysis covering the trends shaping global currency markets.


