


Introduction to Bollinger Bands® in Forex Trading
Bollinger Bands® are one of the most widely used technical indicators across all financial markets, including forex. Designed to help traders identify relative highs and lows, this indicator plays a critical role in understanding market volatility, price behavior, and trend structure.
In this article, I will explain what Bollinger Bands® are, how they work, and how traders can apply them in practical forex trading strategies. We will focus on two of the most commonly used approaches: trading with the trend and the Bollinger Band® squeeze—both suitable for beginner and intermediate traders.
What Are Bollinger Bands® and How Do They Work?
Bollinger Bands® are a versatile technical analysis indicator developed by John Bollinger, a well-known market analyst and author. The indicator was created to help traders objectively identify overbought and oversold conditions in markets that are constantly changing.
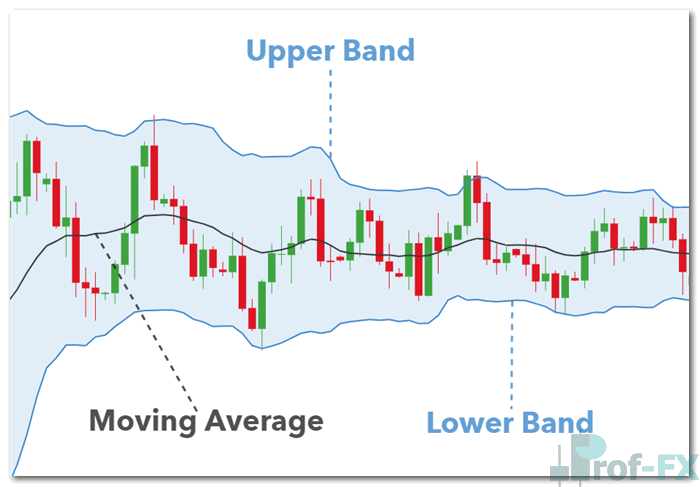
The Bollinger Bands® indicator consists of three components:
- An upper band
- A lower band
- A moving average line (typically a 20-period simple moving average)
The upper and lower bands are plotted two standard deviations above and below the moving average. Statistically, this means that approximately 95% of price action should occur within these bands under normal market conditions.
Understanding Overbought, Oversold, and Volatility
As a general guideline, when price touches or moves near the upper band, the market is considered overbought. Conversely, when price approaches the lower band, it is considered oversold.
More importantly, Bollinger Bands® provide valuable insight into market volatility:
- Contracting bands indicate low volatility and often signal a range-bound market
- Expanding bands indicate rising volatility and often precede breakouts or strong trending moves
This dynamic nature makes Bollinger Bands® especially useful in forex markets, where volatility is driven by macroeconomic data, central bank policy, interest rate expectations, and institutional trading activity.
How to Trade Forex Using Bollinger Bands®
There are several techniques traders use when applying Bollinger Bands® to forex trading. Among the most popular and effective are:
- Trading with the market trend using Bollinger Bands® as dynamic support and resistance
- Trading the Bollinger Band® squeeze, which focuses on volatility expansion
Both approaches are explained below in a clear and practical way.
Strategy 1: Trading the Trend with Bollinger Bands®
EUR/USD Weekly Chart
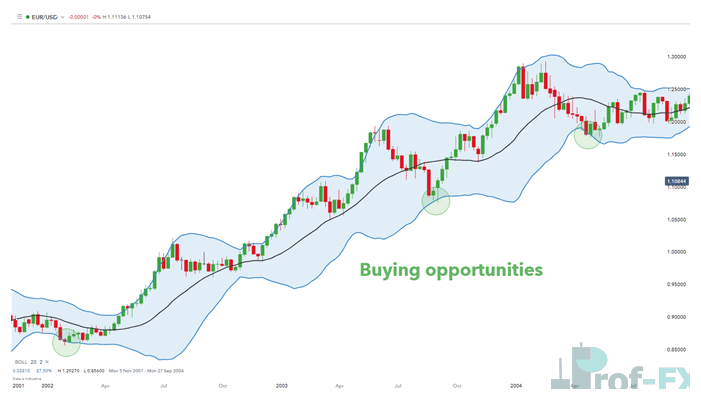
The chart above illustrates an uptrend in EUR/USD, characterized by a series of higher highs and higher lows. In trending markets, Bollinger Bands® act as dynamic support and resistance levels rather than fixed price points.
In an uptrend:
- The lower Bollinger Band® serves as a support zone
- When price pulls back and touches the lower band, traders look for long (buy) opportunities
- The upper Bollinger Band® is commonly used as a take-profit target
This concept applies equally to downtrends, where traders sell near the upper band and target the lower band.
Steps to Trade the Trend with Bollinger Bands®
First, identify the prevailing trend using market structure. Next, observe how price reacts to the upper and lower bands. Enter trades in the direction of the trend when price interacts with the appropriate band. Finally, use the opposite band as a logical target area.
This approach works particularly well when combined with broader trend analysis and price action, and it aligns traders with dominant market momentum.
Strategy 2: Trading the Bollinger Band® Squeeze
EUR/USD Weekly Chart
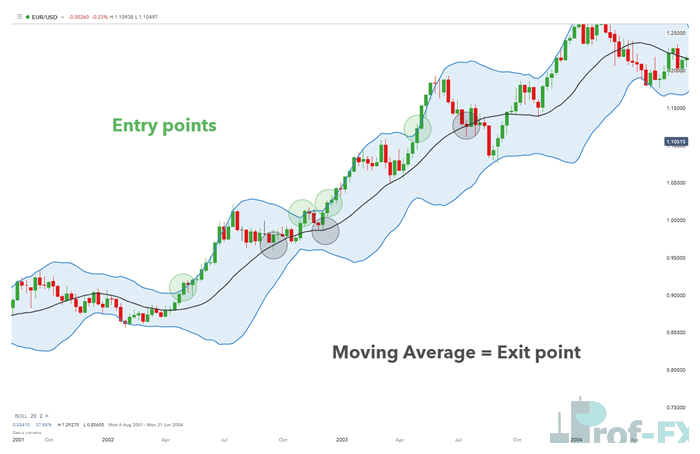
The Bollinger Band® squeeze focuses on changes in volatility. When the bands contract tightly, it signals a period of low volatility, often preceding a sharp price move.
In this strategy, traders wait patiently for price to break above or below the bands, depending on the broader trend direction.
In the example above:
- The green highlighted areas show breakouts during an uptrend
- Entry points are identified when price closes outside the upper band
- After entry, price often begins “walking the band”, where candles follow the upper band closely
- As volatility increases, the bands expand, confirming momentum
The black shaded circles represent areas where traders may choose to take profit, typically before price retraces toward the moving average.
How to Trade the Bollinger Band® Squeeze Effectively
When applying this strategy, traders should follow a disciplined process. First, look for periods of contracting bands, signaling low volatility. Then, wait for a confirmed breakout above or below the bands. Once in the trade, monitor price behavior and consider exiting when price returns toward the moving average, or when momentum begins to fade.
This strategy is particularly effective during news-driven markets and periods of expanding volatility caused by economic releases or shifts in market sentiment.
Why Bollinger Bands® Are Valuable for Forex Traders
Bollinger Bands® remain popular because they adapt to changing market conditions. Unlike static indicators, they respond to volatility, making them especially useful in forex markets influenced by global economic cycles, central bank decisions, and institutional capital flows.
When used correctly, Bollinger Bands® help traders improve timing, manage risk, and avoid trading during unfavorable market conditions.
Conclusion
Bollinger Bands® are a powerful yet beginner-friendly technical indicator. Whether trading trends or volatility breakouts, the key is understanding how price interacts with the bands, rather than using them in isolation.
By combining Bollinger Bands® with proper trend analysis and disciplined trade management, forex traders can significantly improve their consistency and decision-making in the market.


