


Understanding Triangle Patterns in Technical Analysis
Triangle patterns are classic technical formations that appear when price action oscillates between support and resistance, gradually compressing as the market consolidates. This tightening of price range reflects a temporary balance between buyers and sellers, often preceding a decisive move.
As price continues to trade within narrowing boundaries, market pressure builds. Much like a spring being compressed over time, this consolidation phase eventually leads to a breakout, either to the upside or the downside.
Triangle patterns are especially valuable to forex traders because they offer clear structure, defined risk, and objective breakout signals.
How Triangle Patterns Form on the Chart
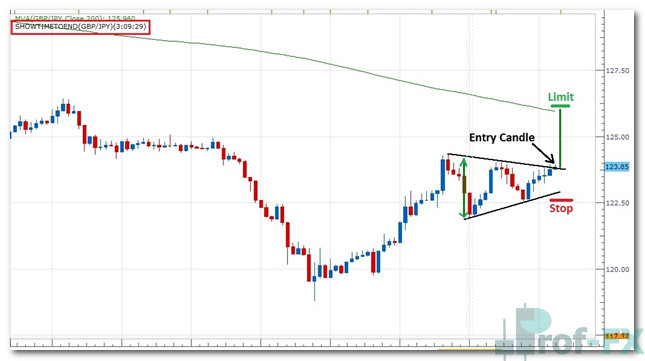
On the 4-hour chart of GBP/JPY, price can be seen gradually “coiling up” between:
- Support, represented by the lower black trend line
- Resistance, represented by the upper black trend line
As price makes progressively higher lows and lower highs, volatility contracts and the trading range narrows. This compression phase signals that the market is preparing for its next directional move.
Identifying the Breakout Entry Signal
The entry signal for a triangle pattern is based on candle close, not just intrabar price movement. This distinction is critical for avoiding false breakouts.
In the example shown:
- The candle labeled “entry candle” is positioned just above triangle resistance
- If this candle closes above the resistance line, it confirms a bullish breakout
If price fails to close beyond the triangle boundary, patience is required. Traders should remain neutral and wait for a confirmed breakout—either bullish or bearish—before committing capital.
Stop Loss Placement for Triangle Breakouts
Once a valid breakout is confirmed, risk management becomes the priority.
Bullish Breakout
- Enter a long (buy) position
- Place the stop loss just below the support line, in the area marked “stop” in red
Bearish Breakout
- Enter a short (sell) position
- Place the stop loss just above the resistance line
This placement ensures that risk is logically tied to the structure of the pattern. If price re-enters the triangle, the breakout thesis is invalidated.
How to Set Profit Targets Using the Triangle Measurement
Triangle patterns offer a straightforward method for estimating profit potential.
At the start of the triangle, measure the vertical distance between support and resistance. This distance—highlighted by the green line with arrowheads—represents the projected move following a breakout.
Once the breakout occurs:
- Replicate that same distance from the breakout point
- Use it as a guide to determine your take-profit level
In a bullish breakout, project the measured distance upward from resistance.
In a bearish breakout, project the distance downward from support.
To improve execution probability, traders often place the take-profit order slightly before the projected target, increasing the likelihood that price reaches the level before reversing.
Why Triangle Patterns Are Effective for Risk Control
One of the key advantages of triangle patterns is their clearly defined structure. Traders know in advance:
- Where to enter
- Where to place the stop loss
- Where to take profit
This clarity supports favorable risk-to-reward ratios and reduces emotional decision-making. When combined with disciplined execution and proper position sizing, triangle patterns can become a reliable component of a trader’s technical toolkit.
Final Thoughts on Trading Triangle Patterns
Triangle patterns reflect periods of consolidation where the market is preparing for expansion. By waiting for confirmed breakouts and using the pattern’s structure to define risk and reward, traders can approach these setups with confidence and objectivity.
As with all technical patterns, triangles do not guarantee success. Consistent profitability comes from combining pattern recognition with sound risk management, patience, and discipline.
Master these principles, and triangle patterns can serve as a powerful framework for trading breakouts in the forex market.


