


When it comes to the price movement of any financial instrument, there are only three possible directions a price can follow. It can be in an uptrend (Bullish market), downtrend (Bear market) or in a sideways trend which implicates a fixed trading range.
As we have all heard the phrase ‘A trend is your friend’, it is vital to base your strategy in the direction of a trend. There are indeed many tools that one can use to analyze charts. However, when it comes to identifying the trends, what better tool to use other than the trend lines.
IMPORTANT: This mini series of forex trading blogs are not considered advice on how you should trade, but merely is providing a tool you can use to compliment your existing fx trading strategy.
What is a trend line?
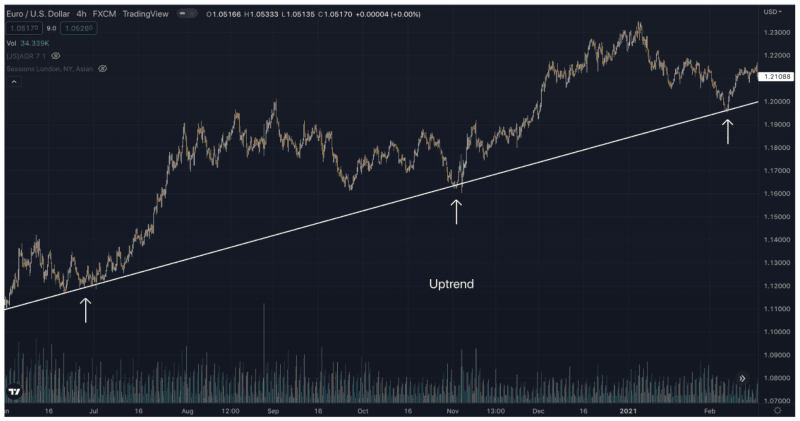
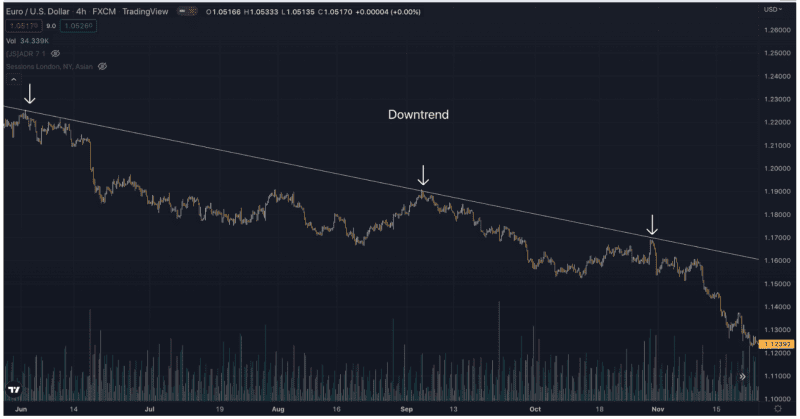
A trend line is formed when two or more pivot highs or pivot lows are connected. In an uptrend, it is when you connect higher lows whereas in a downtrend, it is when you connect lower highs. Hence, the resulting line after connecting these price points is called a trend line. This helps in identifying the trend (direction) of the price for any pair on any timeframe.
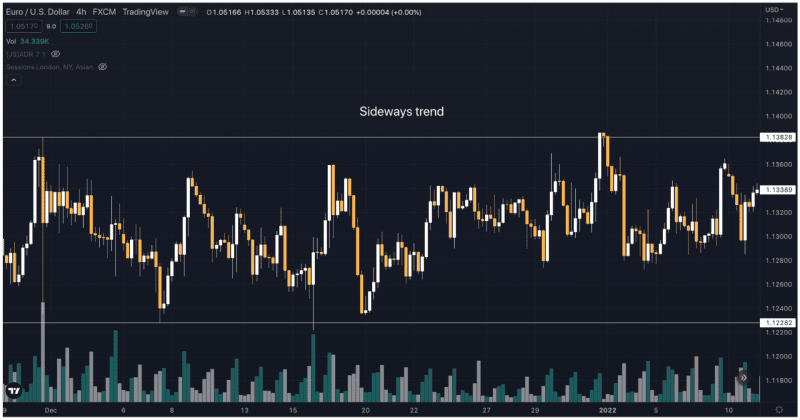
For further clarity, below are the charts of EURUSD on 4 hourly timeframe visualizing trend lines for an uptrend, downtrend, and sideways trend.
How drawing trend lines can be crucial for executing trades?
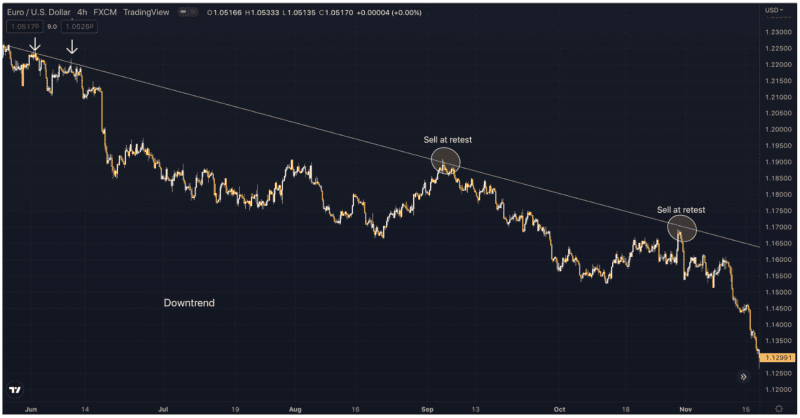
The trend line identifies the trend of the price movements and also indicates support and resistance levels. Therefore:
1. When the price is retesting the trend line, it can be seen as an opportunity to execute a trade.
2. When a trend changes, traders should consider potentially entering a trade. You can identify a potential change in trend when the price breaks out of the trend line and then retests it that acts as a support or resistance (depending on the trend) which can be an ideal time to execute a trade.
Let us now examine these trade opportunities through a chart for a better understanding. Below is the chart of EURUSD in a downtrend which is creating an opportunity for a sell at a retest. Likewise, it would create an opportunity to buy at a retest in an uptrend.
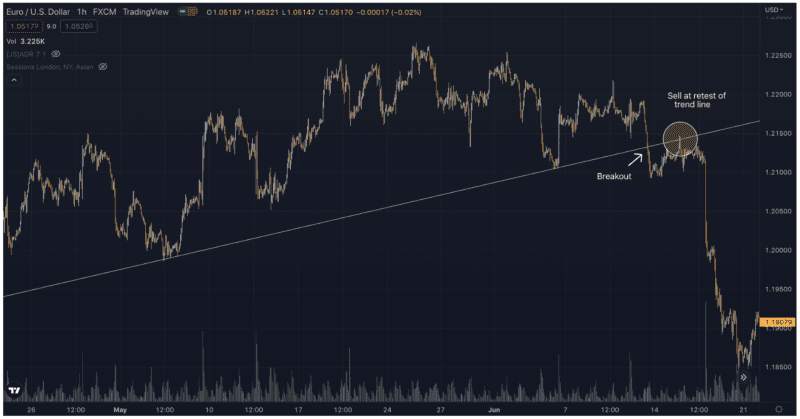
What if the price breaks out of the trend line?
Let us take an example of an uptrend. If the trend line gets broken in an uptrend, it is a signal of the exhaustion of buying pressure followed by a greater sell pressure which results in a breakout, thus indicating a potential trend reversal. This would create an opportunity to sell at a retest as demonstrated in the chart below. Likewise, a break of trend line in a downtrend would create an opportunity to buy at a retest.
When you are trading at any forex prop firm or trading a live funded account, you should always practice good risk management. Have a stop loss, control your lot size and use what you feel comfortable trading. Trend lines can be an essential tool to blend in your trading strategy, given a trader keeps all proper risk parameters in check.
If you are new to this forex blog series, make sure you’ve read our previous episodes, 3 Ways to use Moving Averages and Support and Resistance.


