


When traders ask about the “best” indicator to use, the first and most important principle to understand is this: every indicator is derived from price action. No matter how advanced or popular an indicator may be, it always comes after price action—not before it.
In other words, indicators do not lead the market. Price action leads.
Because of this, price action should always be treated as the primary source of information in trading. Indicators are secondary tools whose role is to help confirm what price is already telling us.
Price Action: The Foundation of All Trading Decisions
Before a trader even thinks about using an indicator for an entry, one question must be answered clearly:
What is price action doing right now?
This usually means identifying the market trend. Once the trend is established, indicators can then be used appropriately—to help time entries in the direction of that trend. Skipping this step is one of the most common mistakes made by beginner traders.
Simply put:
Price action is Indicator #1.
Indicators should never be used in isolation. They are most effective when they are aligned with the broader structure of the market.
Example: Reading the EUR/GBP Market on the 1-Hour Chart
Let’s apply this concept using a practical example. Below is a 1-hour chart of the EUR/GBP currency pair.
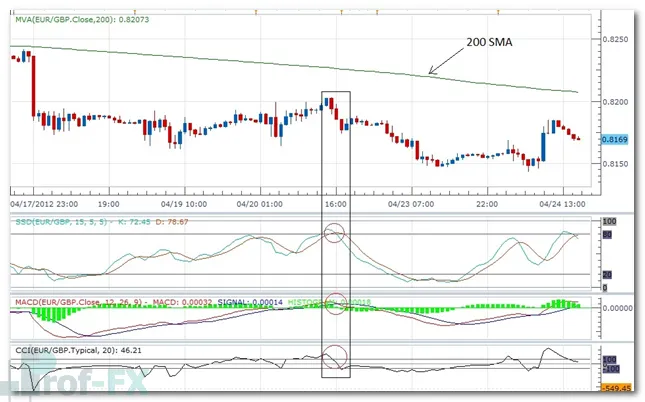
The first observation we make is that EUR/GBP is in a downtrend. This conclusion is not based on a single signal, but on multiple layers of price-based evidence.
Identifying the Downtrend with Market Structure
On the higher time frames—the Daily and 4-hour charts—the pair has consistently formed lower highs and lower lows. This price structure is a textbook definition of a downtrend and is one of the most reliable forms of trend analysis in technical trading.
In addition to that, price is trading below the 200 Simple Moving Average (200 SMA) on each of these time frames. The 200 SMA is a widely recognized institutional indicator used to gauge long-term trend direction in forex, equities, and other financial markets.
Adding Currency Strength Analysis for Confirmation
When we incorporate a Strong/Weak analysis, the picture becomes even clearer. In this case:
- The Euro (EUR) is fundamentally and technically weak
- The British Pound (GBP) is relatively strong
This alignment between price structure, moving averages, and currency strength tells us something critical:
selling EUR/GBP is the higher-probability trade because it aligns with the dominant trend.
Using Indicators Correctly Within a Trend
Once the trend direction is clearly defined, we can then look at indicators—not to predict direction, but to fine-tune entries.
On this chart, three commonly used oscillator indicators are applied:
- Slow Stochastics
- MACD (Moving Average Convergence Divergence)
- CCI (Commodity Channel Index)
All three indicators are widely used in forex trading and are especially popular among retail traders.
Sell Signals in a Downtrend Explained
In a downtrend, each indicator generates a sell signal using its own methodology:
- Stochastics: A sell signal occurs when the %K line (blue) crosses below the %D line (red)
- MACD: A sell signal appears when the MACD line (red) crosses below the Signal line (blue)
- CCI: A sell signal is triggered when the CCI line moves below the +100 level
As shown on the chart, all three indicators generate their sell signals at nearly the same point in time.
So, Which Indicator Is the “Best”?
This brings us to the key question:
If all three indicators give the same signal at the same time, which one is the best?
The honest answer is this: in this context, they are functionally equivalent.
Each indicator confirms the same underlying market condition because they are all responding to the same price movement. None of them is superior in this situation. The signal quality comes from price action and trend alignment, not from the indicator itself.
This is an important lesson for traders, especially beginners:
There are no absolute best indicators in trading.
Choosing the Right Indicator for You as a Trader
Since indicators often provide similar signals, the real decision comes down to personal preference and consistency.
The most practical approach is simple and highly effective:
- Test each indicator individually
- Use it over a large sample size (at least 100 trades)
- Evaluate which one you understand best and execute most confidently
Think of it like test-driving a car before buying it. Once you decide which indicator suits your trading style, stick with it.
Using multiple oscillators on the same chart is usually unnecessary and often redundant. Too many indicators can create confusion, slow decision-making, and lead to analysis paralysis.
Final Thoughts: Simplicity and Consistency Win
Successful trading is not about finding a magical indicator. It is about:
- Understanding price action
- Identifying the trend
- Using one reliable indicator to assist with timing
- Executing the same process consistently over time
When you respect price action as the primary driver of the market and use indicators as supportive tools, your trading decisions become clearer, more disciplined, and statistically stronger over the long run.
That is where real edge in forex trading comes from—not from the indicator itself, but from how you use it.


