


Day trading with Bollinger Bands® is not the most common way traders use this indicator. However, among experienced intraday traders, Bollinger Bands® remain a valuable tool – particularly when trading consolidating forex markets. When applied correctly, this approach can also serve as a foundation for Bollinger Bands® scalping strategies, especially during periods of low volatility such as the Asian trading session.
In this guide, I will explain how Bollinger Bands® can be used effectively for intraday trading, highlight their strengths and limitations, and show how beginner traders can apply this strategy with clarity and discipline.
This article explores:
- Why traders use Bollinger Bands®
- How to apply Bollinger Bands® in intraday forex trading
- The advantages and limitations of day trading with Bollinger Bands®
This discussion assumes a basic understanding of Bollinger Bands®. If you need a refresher, reviewing a foundational guide on Bollinger Bands® in forex trading is highly recommended.
Why Use Bollinger Bands® for Forex Trading?
One of the main reasons traders are drawn to Bollinger Bands® is their versatility. The indicator can be applied across a wide range of trading styles, including day trading, trend-following strategies, breakout setups, and even multi-indicator systems when combined with tools such as MACD or RSI.
Bollinger Bands® were developed by John Bollinger in the 1980s and are designed to measure price volatility. Unlike indicators that focus solely on momentum or trend direction, Bollinger Bands® adapt dynamically to market conditions. When volatility increases, the bands widen. When volatility decreases, the bands contract.
This adaptability makes Bollinger Bands® particularly useful in forex markets, where volatility changes frequently depending on trading sessions, economic releases, and institutional participation. As a result, traders ranging from complete beginners to seasoned professionals continue to rely on this indicator.
How to Use Bollinger Bands® for Intraday Trading
Bollinger Bands® Scalping Example on EUR/GBP
To illustrate how Bollinger Bands® can be used in day trading, let’s look at a practical intraday scalping setup on the EUR/GBP currency pair using a five-minute chart.
This strategy is designed specifically for low-volatility environments, where Bollinger Bands® appear narrow. The standard Bollinger Bands® settings—20-period moving average with 2 standard deviations—are used. The time window for this setup runs from 18:00 to 06:00 GMT, which typically corresponds with the Asian trading session.
During this period, the forex market often experiences reduced volatility and prolonged consolidation phases. These conditions align well with the strengths of a Bollinger Bands® scalping approach.
In this system:
- The lower Bollinger Band® acts as a dynamic support level.
- The upper Bollinger Band® functions as dynamic resistance.
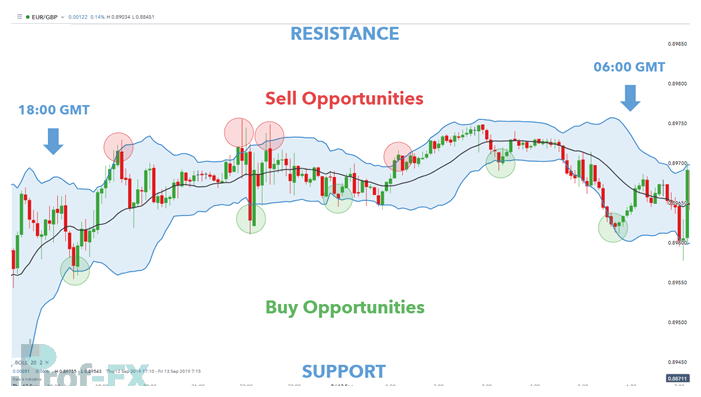
When price approaches the lower band, it signals a potential buying opportunity, assuming the market remains range-bound. Conversely, when price reaches the upper band, it highlights a potential sell signal. Traders can also use these same bands as logical exit points, depending on trade direction and risk management rules.
This example demonstrates how Bollinger Bands® can be applied beyond trend or breakout strategies, offering a structured method for trading sideways markets—a scenario many traders struggle with.
Advantages and Limitations of Day Trading with Bollinger Bands®
Day trading with Bollinger Bands® offers several benefits, particularly for traders who prefer simplicity and structure. One of the most notable advantages is that this strategy is easy to understand and implement, making it accessible to novice traders. Because Bollinger Bands® already incorporate volatility into their calculation, there is often no need to add multiple supporting indicators, which helps keep charts clean and decision-making straightforward.
However, this approach is not without limitations. Bollinger Bands® scalping strategies perform best in low-volatility, range-bound markets. When volatility expands—such as during major economic releases or overlapping trading sessions—the strategy can quickly lose effectiveness. In addition, because trades are typically taken within narrow ranges, the risk-to-reward ratio may be relatively modest compared to trend-following strategies.
Understanding these strengths and weaknesses is essential. Traders who recognize when market conditions are suitable—and when they are not—are far more likely to use Bollinger Bands® successfully in a day trading context.
Expanding Your Knowledge of Bollinger Bands®
Mastering Bollinger Bands® requires more than memorizing a single setup. Traders benefit greatly from understanding how volatility, market sessions, and price behavior interact. Exploring how Bollinger Bands® work in combination with other indicators, such as MACD, can further refine trade timing and confirmation.
For those serious about improving their technical analysis skills, studying a curated selection of the most effective forex indicators can provide broader market insight. Additionally, developing the psychological and behavioral traits of a successful trader is just as important as mastering any single indicator.


