


The death cross is a technical term frequently referenced in professional trading circles due to its effectiveness in identifying potential trend reversals and its straightforward application on price charts. It is widely used by traders and analysts to detect shifts in market momentum, particularly when a bullish trend begins transitioning into a bearish phase.
This article explains the concept of the death cross, how to accurately identify it on a chart, and why it remains a highly respected technical signal in market analysis. In addition, traders may also benefit from reviewing the Golden Cross, which serves as the bullish counterpart and can be used alongside simple moving averages (SMA) to assess changing trend conditions.
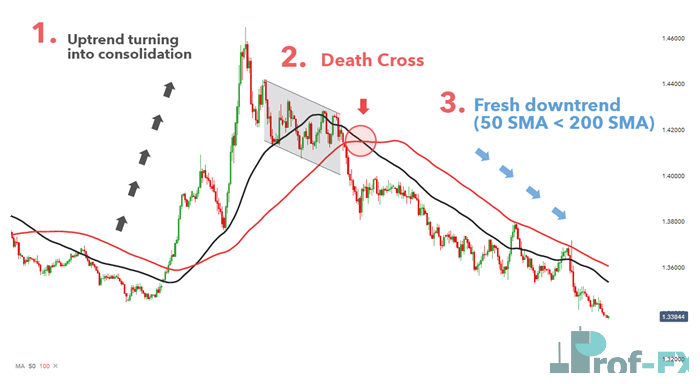
What Is a Death Cross?
A death cross occurs when the 50-period Simple Moving Average (SMA) crosses below the 200-period SMA.
This crossover creates a bearish market backdrop, indicating that short-term price momentum is weakening and moving lower. More importantly, it may signal the early stages of a new long-term downtrend, especially when supported by sustained selling pressure and declining price action.
The logic behind this signal is based on the behavior of two moving averages with different time sensitivities.
The 50 SMA is calculated as the arithmetic average of the closing prices over the most recent 50 periods or 50 days when using a daily chart. Because it reflects a shorter period, it responds more quickly to recent price fluctuations.
By contrast, the 200 SMA averages the last 200 closing prices, making it significantly smoother and less reactive to short-term price changes. This longer-term average is widely used to assess the broader market trend.
When the faster-moving 50 SMA drops below the slower 200 SMA, it objectively confirms that recent price weakness is strong enough to shift the broader trend structure into bearish territory.
To better understand this concept, traders may also refer to our guide: “Moving Average Explained for Traders”, which covers how the simple moving average is calculated and applied in technical analysis.
How to Identify a Death Cross
There are three main stages in the formation of a death cross, and understanding each stage is essential for interpreting the signal correctly.
1. The Lead-Up Phase
In the first stage, price action begins to consolidate, or in some cases, declines sharply after a prolonged bullish trend.
This phase is critical because it often provides the earliest indication that the uptrend is losing momentum.
A period of consolidation typically suggests that buyers are becoming less aggressive and that the market may be preparing for a possible trend reversal.
During this stage, the 50 SMA still remains above the 200 SMA, meaning the death cross has not yet occurred, but the market may already be showing warning signs.
This phase should not be ignored, as experienced traders often monitor it closely for confirmation of weakening bullish strength.
2. The Death Cross Formation
This is the exact moment when the 50 SMA crosses below the 200 SMA.
At this point, the market officially forms the death cross, which is widely interpreted as a bearish confirmation signal.
For many traders, this crossover serves as a trigger point to begin looking for short-selling opportunities, bearish continuation setups, or confirmation that an existing long position should be exited.
The death cross itself does not guarantee an immediate downward move, but it significantly strengthens the bearish technical outlook.
3. Continued Downward Momentum
After the crossover has formed, the ideal next phase is continued bearish price movement.
In many cases, price action continues to move lower, establishing a fresh downtrend.
A particularly strong technical confirmation occurs when the 50 SMA begins acting as dynamic resistance, meaning that price repeatedly fails to break above it.
As long as price continues trading below the 50 SMA, the bearish bias remains technically intact.
This stage often provides the clearest trend-following opportunities for traders who prefer confirmation over early entry.
The Simple Moving Average as a Lagging Indicator
By its nature, the simple moving average is a lagging indicator, which means it is based entirely on historical price data.
Read: What Are Lagging Indicators? A Simple Breakdown for Better Insights
Rather than predicting future movement, the SMA helps traders interpret current market conditions through past price behavior.
Because of this, the death cross signal will naturally appear after part of the downward move has already occurred.
This built-in delay is often referred to as indicator lag.
From an objective perspective, this lag can be interpreted in two ways.
Some traders may see it as a missed opportunity, arguing that a portion of the move has already taken place before the signal is confirmed.
However, many experienced traders view this delay as an advantage because it provides stronger confirmation that the trend has genuinely changed, rather than simply reacting to a temporary retracement or short-term pullback.
This added level of confirmation is particularly valuable in volatile forex markets, where false breakouts and short-lived reversals are common.
For short-term traders, such as scalpers and day traders, who aim to capture smaller intraday moves, the standard 50 and 200 SMA settings may be too slow.
In these cases, the moving averages can be made more responsive by reducing both the short-term and long-term periods.
For example, traders may choose combinations such as:
- 20 SMA and 50 SMA
- 10 SMA and 30 SMA
This adjustment allows the indicator to react faster to short-term momentum shifts while maintaining the same crossover logic.
From a professional trading standpoint, the death cross remains one of the most credible and widely recognized bearish signals in technical analysis, particularly when combined with price action, support and resistance zones, and volume confirmation.
Prof FX provides forex news and professional technical analysis focused on the trends that influence the global currency markets.


")
