


The ascending triangle pattern, often referred to as a rising triangle, is one of the most reliable bullish continuation patterns in technical analysis. It typically forms mid-trend, signaling that the market is pausing before potentially continuing higher in the direction of the prevailing trend.
For traders—especially those new to chart pattern analysis—the ascending triangle offers a structured way to anticipate breakouts, define risk, and project realistic profit targets.
What You’ll Learn in This Guide
In this article, we will cover:
- What an ascending triangle pattern is
- How to identify an ascending triangle on forex charts
- How professional traders trade the ascending triangle
- Advantages and limitations of the pattern
- How to deepen your understanding of forex chart patterns
What Is an Ascending Triangle Pattern?
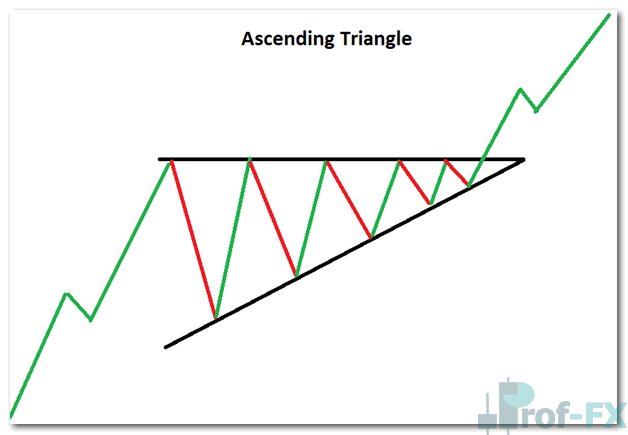
The ascending triangle is a bullish continuation pattern characterized by:
- A rising lower trendline (higher lows)
- A flat upper trendline acting as resistance
This structure shows that buyers are becoming increasingly aggressive, stepping in at higher price levels, while sellers continue to defend a fixed resistance area. Over time, this pressure often results in a bullish breakout above resistance.
The pattern is considered complete once price breaks and sustains above the flat upper trendline, confirming continuation of the broader uptrend.
Ascending Triangle Pattern Illustration
When the Ascending Triangle Acts as a Bottoming Pattern
Although the ascending triangle is primarily viewed as a continuation pattern, context matters.
When the pattern appears:
- Mid-uptrend → continuation is more likely
- At the end of a downtrend → it may signal a bottoming process
In a downtrend, the formation can indicate that bearish momentum is fading and that buyers are beginning to regain control. This is why the location of the pattern within the broader trend is critically important before placing any trades.
How to Identify an Ascending Triangle on Forex Charts
Once traders know what to look for, the ascending triangle becomes relatively easy to spot.
Key Characteristics of a Valid Ascending Triangle
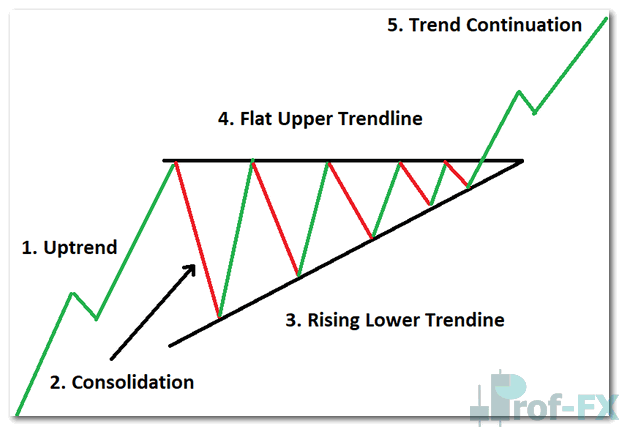
1. Existing Uptrend
The market should already be in an uptrend before the pattern forms. This confirms that the ascending triangle is being traded as a continuation pattern, not in isolation.
2. Consolidation Phase
The pattern begins to form as price enters a consolidation phase, where volatility temporarily contracts.
3. Rising Lower Trendline
By connecting higher swing lows, traders can draw an ascending support trendline. This line reflects increasing buying pressure and reinforces a bullish bias.
4. Flat Upper Trendline (Resistance)
The upper trendline remains relatively flat and acts as resistance. Price may test this level multiple times before the eventual breakout.
5. Breakout and Trend Continuation
A strong breakout above resistance—ideally supported by momentum—confirms the pattern and opens the door for long trade setups.
Ascending Triangle Structure on Forex Chart
Ascending Triangle Measuring Technique
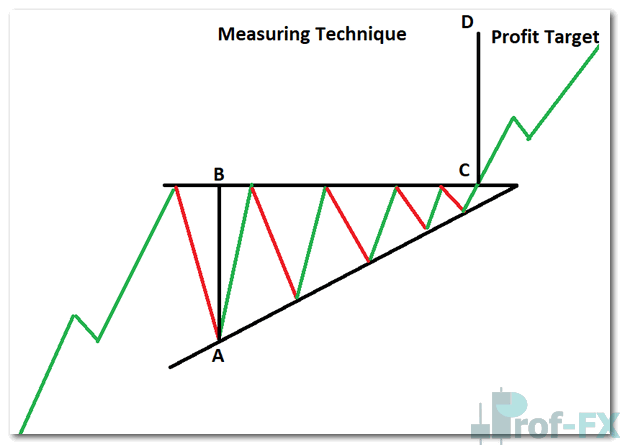
One of the strengths of the ascending triangle is its built-in price projection method, which helps traders estimate potential profit targets.
To apply the measuring technique:
- Measure the maximum height of the triangle—from the lowest point of the rising trendline to the flat resistance line.
- Take that distance and project it upward from the breakout point.
This projected level becomes a logical take-profit zone, rather than a guaranteed price target.
In the illustration below, the distance from A to B is projected from C to D to estimate potential upside.
Ascending Triangle Measuring Example
How to Trade the Ascending Triangle Pattern
Trading the ascending triangle requires patience and discipline.
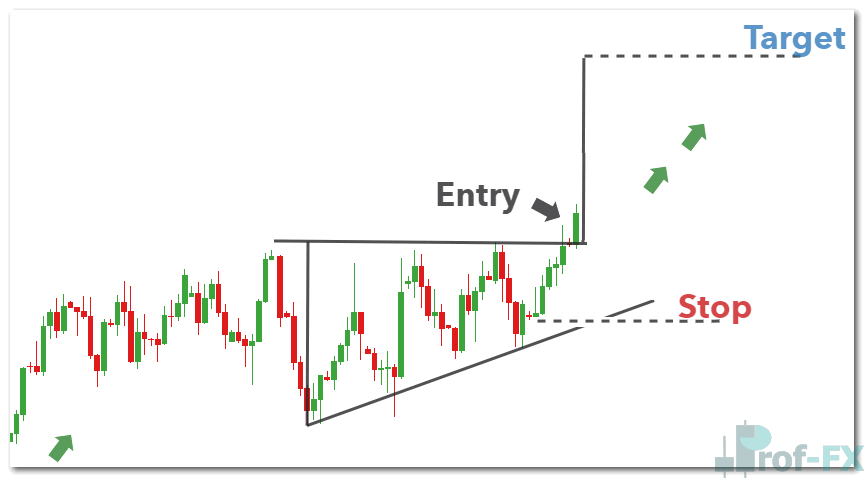
In the USD/CAD example, the broader uptrend is clearly established before the triangle forms. As price consolidates, traders prepare for a potential breakout by applying the measuring technique.
Once price breaks convincingly above resistance, traders may:
- Enter a long position
- Place a stop-loss below the most recent swing low
- Set a take-profit target based on the measured move
This approach ensures trades are structured with defined risk and reward.
USD/CAD Ascending Triangle Trade Example
Advantages and Limitations of the Ascending Triangle
Like all technical patterns, the ascending triangle has both strengths and weaknesses that traders should understand.
Advantages
The ascending triangle:
- Is relatively easy to identify
- Provides a clear, objective profit target
- Works well as an intermediate-term continuation pattern
- Allows traders to trade both the breakout and, in some cases, price action within the triangle (with trend filtering)
Limitations
Traders should also be aware that:
- False breakouts can occur, especially in low-volume markets
- Price may consolidate for an extended period or break lower instead
- Risk management is essential to protect against failed patterns
Expanding Your Knowledge of Forex Chart Patterns
The ascending triangle is just one of many bullish chart patterns used by traders. Related formations include:
- Bullish flags and pennants
- Rising wedges
- Continuation and reversal triangle patterns
To reinforce your understanding:
- Test your skills with the Forex Trading Patterns Quiz
- Build a solid foundation with our New to Forex Trading Course
Regardless of the pattern used, success in trading always comes down to context, confirmation, and disciplined risk management.
Prof FX provides forex news, macroeconomic insight, and professional technical analysis covering the forces that influence global currency markets.


