


Pitchfork analysis and median line trading are advanced yet highly practical tools used by professional traders to define market structure during trending conditions. In this article, I will walk you through how pitchforks and their parallel lines can be used to measure the slope (gradient) of a market trend and identify high-probability support and resistance levels.
The primary objective of this methodology is simple: to impose structure on price movement. By doing so, traders gain clearer reference points for potential entries, exits, and price targets during both market advances and declines.
We will begin by discussing the core concepts behind pitchforks and median lines, followed by a step-by-step breakdown of a real market setup. This approach mirrors how professional traders formulate trading opportunities using slope-based analysis.
This article is the second part of a broader educational series focusing on pitchforks and trend slope analysis:
- Foundations of Technical Analysis: Using Parallels and Pitchforks / Median Lines
- Part One: Introduction to Basic Trendline Analysis
- Part Three: Multi Time Frame Analysis
Understanding Andrew’s Pitchfork in Technical Analysis
Andrew’s Pitchfork was developed by Dr. Alan Andrews, a pioneer in classical technical analysis. The pitchfork is a trend-based analytical tool designed to identify price channels, reaction zones, and the directional bias of a market.
At its core, a pitchfork provides traders with:
- A structured price channel
- Clearly defined support and resistance boundaries
- A framework for analyzing price behavior over both price and time
This makes the pitchfork particularly valuable in trending markets, where price often respects geometric symmetry and slope consistency.
EUR/NZD Price Chart Showing an Andrew’s Pitchfork
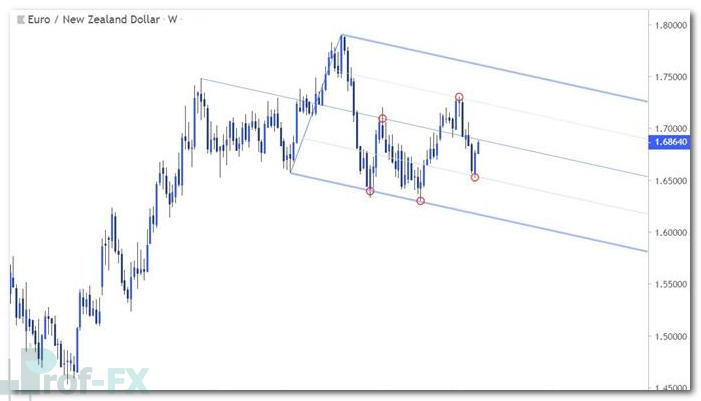
What Is a Median Line and Why It Matters
A median line is the central line that bisects a price channel created by a pitchfork. It acts as a gravitational center for price action and often becomes a key decision point for the market.
In practice:
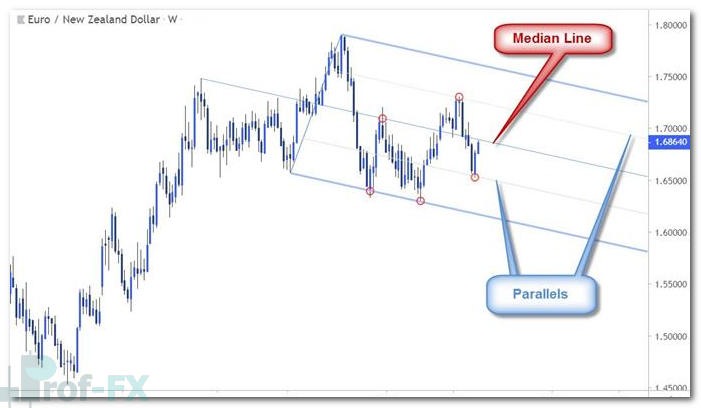
- When price breaks above the median line, the upper parallel becomes the next logical target
- When price breaks below the median line, focus shifts toward the lower parallel
Median lines frequently act as pivot points, triggering reversals, consolidations, or trend continuations. For this reason, they are closely monitored by institutional traders and technically driven market participants.
EUR/NZD Chart Showing Parallels Within a Pitchfork
How to Trade Using Pitchforks and Median Lines
The foundational assumption in pitchfork analysis is that price tends to gravitate toward the median line. When price moves away from the upper or lower parallel, it often reverts toward the median line—unless momentum is strong enough to break through it.
Once the median line is broken:
- Former resistance often becomes support during a bullish move
- Former support may turn into resistance during bearish continuation
This behavior reinforces the idea that pitchforks are not merely visual tools, but dynamic frameworks that evolve with market conditions.
Identifying Market Slope with Parallel Trendlines
The simplest way to begin using pitchfork analysis is to first identify a primary trendline that the market has consistently respected. This trendline establishes the slope of the trend.
Once identified:
- Copy that trendline
- Extend the parallel from a recent significant high or low
- Create a price channel that defines the market structure
If price continues to react at these parallel levels, it confirms that you have correctly identified the dominant gradient of the trend.
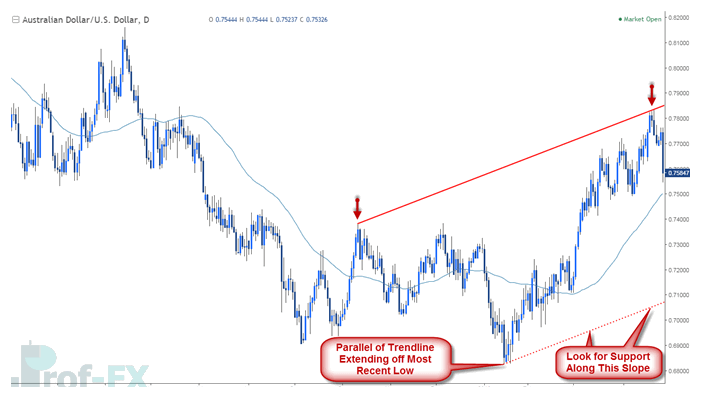
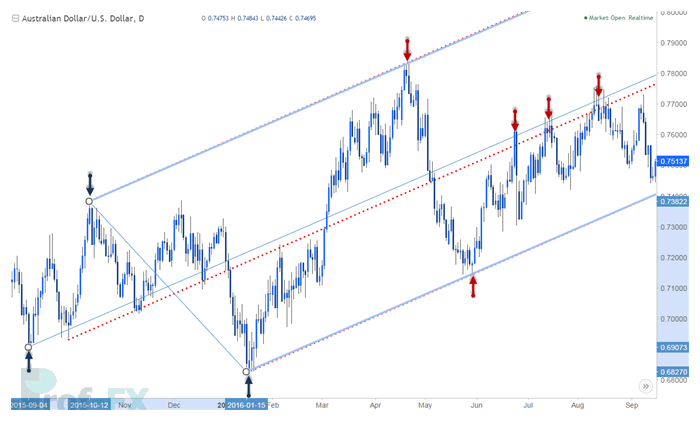
AUD/USD Price Chart Showing a Trendline
Using Parallels to Identify Key Price Pivots
Consider the AUD/USD example where a resistance trendline connects the major peaks from late 2015 and early 2016. Extending a parallel from the 2016 low provided a critical support level during the sharp decline in late April.
This demonstrates how even basic parallel analysis can uncover high-quality pivot zones, which are essential for defining risk, entries, and exits.
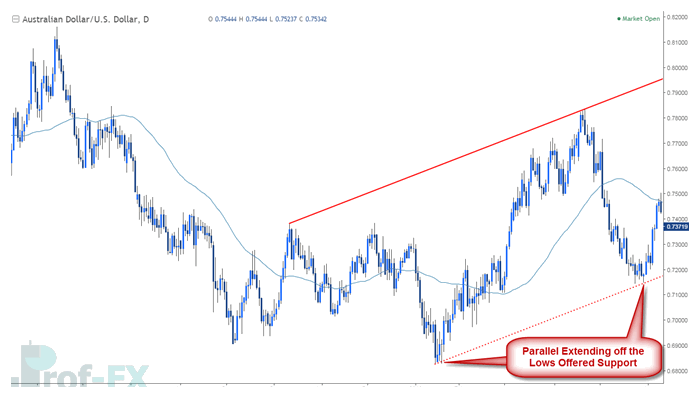
AUD/USD Price Chart Showing a Parallel
Introducing the Median Line as a Price Target
Once support is identified using parallels, the next logical question is: Where does price go next?
This is where the median line becomes invaluable.
In the AUD/USD example, the June rebound from the lower parallel naturally targeted the median line. The market respected this level precisely, forming a pivot before rolling over—clearly illustrating how slope-based targets outperform arbitrary price levels.
AUD/USD Price Chart Showing a Median Line

Applying a Full Pitchfork Formation
Using three reference points—low, high, low—a complete pitchfork can be drawn to define an uptrend. In the AUD/USD case, the slope of this pitchfork matched the previously identified gradient, reinforcing its technical validity.
Each subsequent rally failed at the median line, while the final attempt in August retraced toward the lower parallel. This sequence highlights an essential lesson: identifying the correct slope is more important than the specific tool used.
AUD/USD Price Chart Showing a Pitchfork
How to Properly Draw Andrew’s Pitchfork
When drawing pitchforks, keep the following principles in mind:
Reference Points Matter
- In an uptrend: use low – high – low
- In a downtrend: use high – low – high
Price Behavior Near the Median Line
When price approaches the median line, it will typically:
- Reverse, or
- Break through and accelerate toward the next parallel
Focus on the Slope, Not Perfection
The slope is the most critical element. Ask yourself:
- Has price consistently reacted to this gradient?
- Are pivots forming at parallel touchpoints?
Sometimes reference points must be adjusted to better fit the true market slope.
Adapting After a Breakout
- If price breaks below an ascending pitchfork, look for a high–low–high correction
- If price breaks above a descending pitchfork, identify a low–high–low reversal
Pitchforks are most powerful when combined with confluent technical factors, such as:
- Moving averages
- Fibonacci retracements
- Monthly or yearly highs and lows
- Sentiment indicators
Key Takeaways for Pitchfork and Median Line Trading
Pitchforks and median lines are powerful tools for traders seeking to define market structure and identify high-probability reaction zones. When applied correctly, they provide clarity in otherwise complex price movements.
Remember, the goal is not prediction – it is context. By understanding slope and structure, traders can make more informed decisions with defined risk and realistic targets.
In Part Three of this series, we will explore Multi Time Frame Analysis, where pitchforks are combined with overlay indicators to enhance timing and trade confirmation.
To continue developing your trading edge, be sure to visit for the Forex Course, and don’t forget to learn in our Free Forex Trading Guides for deeper insight into professional trading methodologies.


