


 |
 |
 |
 |
See also: Quantile Bands MT4 Indicator
PSAR Oscillator MTF Heatmap Indicator for MT4
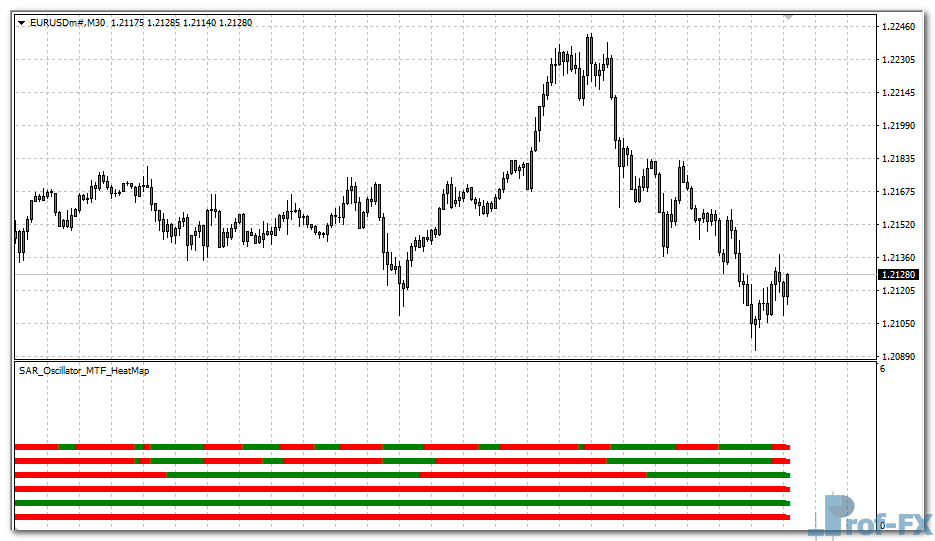
The PSAR Oscillator MTF Heatmap is a unique MetaTrader 4 indicator that combines the power of the Parabolic SAR (Stop and Reverse) across multiple timeframes into a single visual dashboard. This innovative tool allows traders to quickly assess trend direction and market sentiment from the Monthly down to the 1-Minute chart — all in one place.
How the Indicator Works
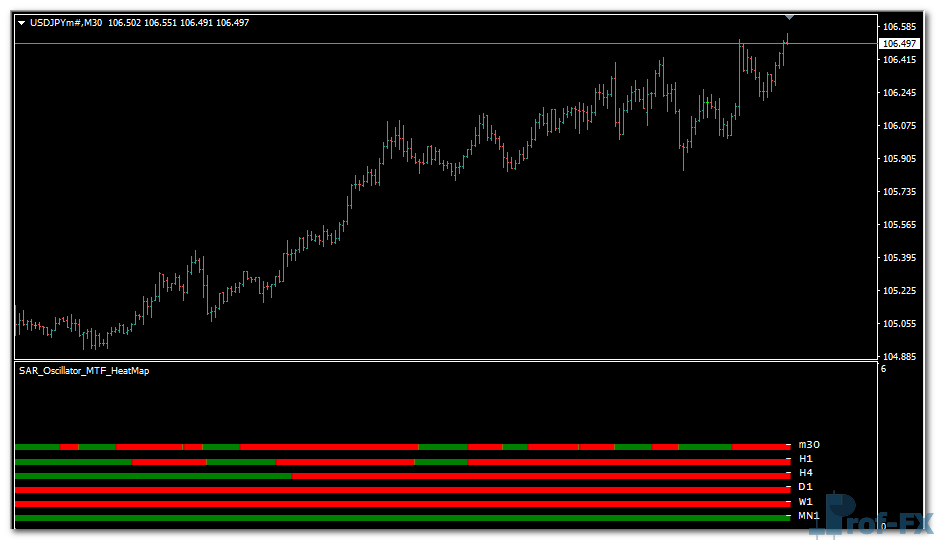
At its core, this indicator uses the built-in Parabolic SAR (iSAR) algorithm to detect trend reversals. It then applies this calculation across nine different timeframes:
- MN1 (Monthly)
- W1 (Weekly)
- D1 (Daily)
- H4 (4 Hours)
- H1 (1 Hour)
- M30 (30 Minutes)
- M15 (15 Minutes)
- M5 (5 Minutes)
- M1 (1 Minute)
For each timeframe, the indicator checks whether the SAR value is above or below the current price.
- When the SAR is below the price, it suggests an uptrend (bullish condition).
- When the SAR is above the price, it indicates a downtrend (bearish condition).
Each of these signals is plotted as a colored arrow inside a heatmap window, giving traders a fast visual overview of the trend status at every timeframe.
Main Features
Multi-Timeframe Parabolic SAR Analysis
Get a complete view of the trend direction across nine key chart periods — from long-term to short-term.
Heatmap Visualization
The indicator displays colored arrows:
- Green for bullish (uptrend) signals.
- Red for bearish (downtrend) signals.
This heatmap structure allows you to instantly see when multiple timeframes align in the same direction — a strong confirmation of trend momentum.
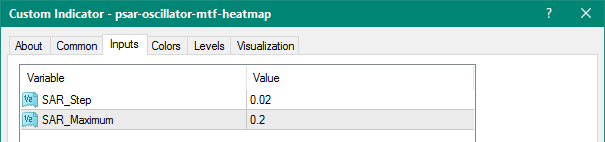
Customizable SAR Settings
You can adjust the SAR Step and SAR Maximum parameters to fine-tune the sensitivity of the signal detection based on your trading strategy.
Lightweight and Fast
Optimized for performance, it calculates multiple timeframe values efficiently without lag, even on lower-end systems.
How to Use the Indicator
1. Attach the indicator to any MT4 chart (currency pair, index, or commodity).
2. The heatmap will appear in a separate window below the main chart.
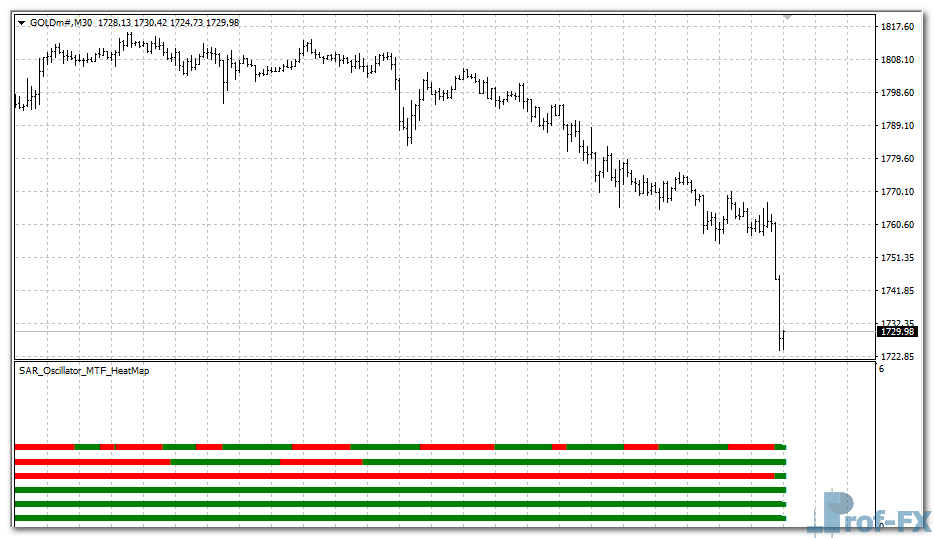
3. Observe the arrow patterns:
- A row of green arrows → market is trending up across timeframes.
- A row of red arrows → market is trending down across timeframes.
- Mixed colors → possible trend consolidation or range phase.
4. Use this visual alignment to confirm entries or exits with your existing strategy.
Best Use Cases
- Trend Confirmation: Confirm the overall direction before entering a trade.
- Multi-Timeframe Alignment: Identify when higher-timeframe trends support your short-term setups.
- Swing & Intraday Trading: Ideal for traders who combine multiple time horizons for decision-making.
- Filtering False Signals: Avoid taking trades against the dominant higher-timeframe trend.
Parameters Overview
| Parameter | Description |
| SAR_Step | Defines the acceleration factor for Parabolic SAR. Default is 0.02. |
| SAR_Maximum | The maximum step size for SAR movement. Default is 0.2. |
You can tweak these parameters to adjust how quickly the SAR responds to price movement — higher values make it more sensitive, while lower values smooth out the signals.
Indicator Display Example
- Green Arrow (Uptrend) → SAR is below price → bullish pressure.
- Red Arrow (Downtrend) → SAR is above price → bearish pressure.
- The arrows stack vertically for each timeframe, forming a “heatmap” of the market structure.
This layered visualization helps you instantly spot when all timeframes are synchronized, a condition often preceding strong breakout or continuation moves.
How to Instal “PSAR Oscillator MTF Heatmap” Indicator for Metatrader 4
- Open your Metatrader 4 platform.
- Download and save the “PSAR Oscillator MTF Heatmap” indicator to your desktop or any other folder located on your local computer.
- Choose “File” then “Open Data Folder” (Ctrl + Shift + D) on your Metatrader 4 platform.
- Explore the following folder: MQL4 > Indicators.
- Copy and paste the “PSAR Oscillator MTF Heatmap” indicator into this folder.
- Restart Metatrader 4.
- “PSAR Oscillator MTF Heatmap” indicators are stored by default in the custom indicator folder.
- To access these indicators, go to Top Menu > Insert > Indicators > Custom.
- In order to add a “PSAR Oscillator MTF Heatmap” indicator to any of your Metatrader 4 charts, you will need to select a forex chart with one mouse click, then go to Top Menu > Insert > Indicators > Custom > click the “PSAR Oscillator MTF Heatmap”.
- Done!
See a complete guide How To Install Metatrader 4 Custom Indicators
Conclusion
The PSAR Oscillator MTF Heatmap is an invaluable tool for traders who rely on multi-timeframe confirmation and visual clarity. By integrating Parabolic SAR analysis from M1 to MN1, it provides an at-a-glance understanding of the market’s overall structure — helping you align your trades with the dominant trend direction.
Whether you’re a scalper, swing trader, or trend follower, this indicator can dramatically enhance your situational awareness and confidence in decision-making.
Free Download PSAR Oscillator MTF Heatmap indicator for Metatrader 4
- psar-oscillator-mtf-heatmap.zip
- Size: 18.4 kb
- Platform: MT4 | Format: .mql4/.ex4 | File: dir9mt4 | Request Remove!


