Pivot Range and Previous HighLow

Pivot Range and Previous HighLow mt4 indicator
Pivot Range and Previous HighLow mt4 indicator Pivot Range and Previous HighLow mt4 indicator

How to Instal “Pivot Range and Previous HighLow” Indicator for Metatrader 4

  1. Open your Metatrader 4 platform.
  2. Download and save the “Pivot Range and Previous HighLow” indicator to your desktop or any other folder located on your local computer.
  3. Choose “File” then “Open Data Folder” (Ctrl + Shift + D) on your Metatrader 4 platform.
  4. Explore the following folder: MQL4 > Indicators.
  5. Copy and paste the “Pivot Range and Previous HighLow” indicator into this folder.
  6. Restart Metatrader 4.
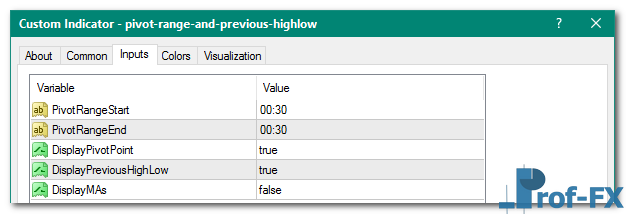
  7. “Pivot Range and Previous HighLow” indicators are stored by default in the custom indicator folder.
  8. To access these indicators, go to Top Menu > Insert > Indicators > Custom.
  9. In order to add a “Pivot Range and Previous HighLow” indicator to any of your Metatrader 4 charts, you will need to select a forex chart with one mouse click, then go to Top Menu > Insert > Indicators > Custom > click the “Pivot Range and Previous HighLow”.
  10. Done!

See a complete guide How To Install Metatrader 4 Custom Indicators

Free Download Pivot Range and Previous HighLow indicator for Metatrader 4

  • pivot-range-and-previous-highlow.zip
  • Size: 19.8 kb
  • Platform: MT4 | Format: .mql4/.ex4 | File: dir7mt4 | Request Remove!
Forex Advertising rectangle - headway
Forex Advertising Package
Gravatar Image
FX Script is a collective of skilled forex traders with extensive knowledge of MetaTrader indicators. Known for their expertise, they regularly contribute to Prof FX, offering practical trading tips and advanced strategies to guide traders towards success in the forex market.

Leave a Reply

Your email address will not be published. Required fields are marked *

3 Powerful RSI Trading Tips

What Is RSI (Relative Strength Index)? The Relative Strength Index (RSI) is one of the most widely used indicators in

Understanding Market Cycles and Their Trading Phases

Market Cycles Explained for Traders and Investors A market cycle describes the natural progression of financial markets as they move

Easy Forex Strategy for Beginners
by James K. - Aug 16 | in Technical Forex

Today, I want to share a forex trading strategy with you, called WhaM. This trading strategy is so easy to

South Korean Won Currency

The South Korean won (KRW) is considered to be an exotic currency in the Forex market. South Korea is the

How Trade with Fractals

The Fractal indicator, invented by Bill Williams is commonly used by forex traders to identify support and resistance levels on

Gold and the Fed
by Prof Team - Jun 25 | in Forex Fundamentals

There were no worldwide financial crises of major magnitude during the Bretton Woods era (1947 to 1971), proving that Gold

How to Trade with the Relative Strength Index (RSI)

The Relative Strength Index (RSI) is one of the most widely used indicators in technical analysis. It helps traders evaluate

Difference of True and False ECNSTP

Since many people trade online, traders have continuously expanded their knowledge and expertise. Years ago, many traders would have struggled