
Market Cycles Explained for Traders and Investors
A market cycle describes the natural progression of financial markets as they move from growth to decline and eventually reset before beginning again. In simple terms, bull markets mature, peak, and then reverse into bear markets, where excesses created during the expansion phase are gradually corrected.
Market cycles have existed for as long as speculation itself. While no two cycles are ever identical in terms of catalysts or macroeconomic drivers, they consistently display similar behavioral patterns. This consistency exists largely because market cycles are driven by human psychology—fear, greed, optimism, and despair repeat themselves across generations.
Most cycles unfold in what can be described as a normal bull-and-bear structure. However, some cycles expand into bubbles or speculative manias, which ultimately result in sharp market crashes. The primary difference lies in the speed and magnitude of price appreciation, as well as the intensity of investor sentiment.
Understanding these phases gives traders a powerful framework to contextualize price action, manage risk, and avoid emotional decision-making.
The Five Core Phases of a Market Cycle
A complete market cycle typically unfolds through five distinct phases:
- Discovery
- Momentum
- Blow-off
- Transition
- Deflation
A full cycle can span several years or even decades. Cyclical (short-term) trends often form within larger secular (long-term) trends, making cycle awareness essential for traders across all timeframes.
Bull Market Phases
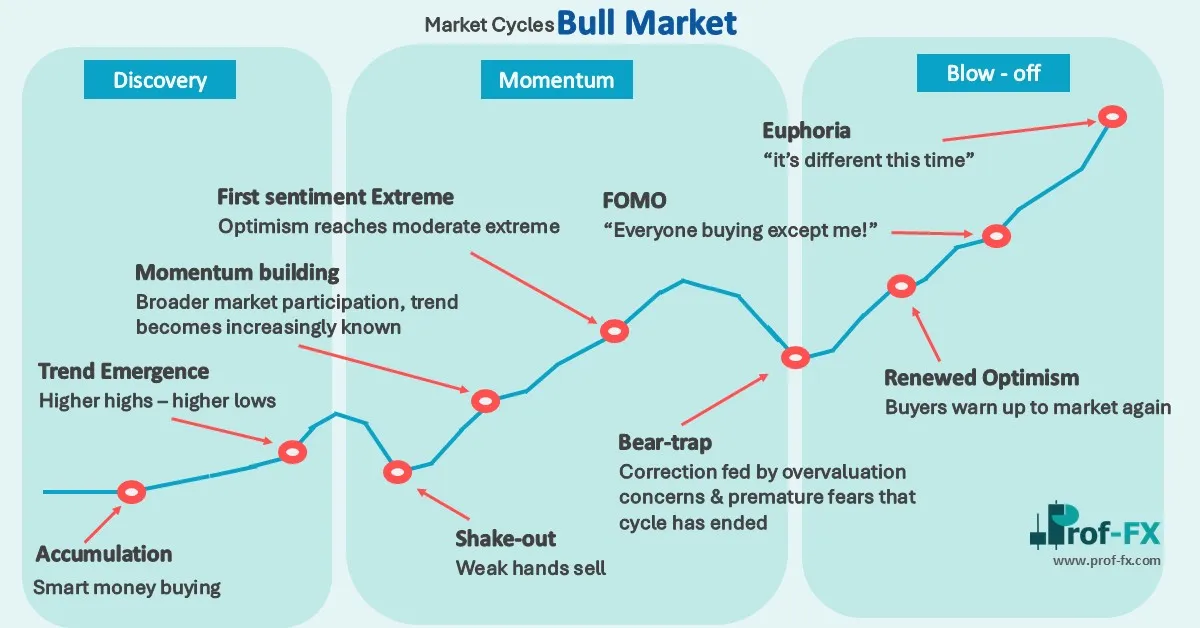
1. Discovery Phase – The Birth of a New Trend
The Discovery Phase marks the quiet beginning of a new bull market. It usually goes unnoticed by the majority of market participants, as sentiment is still heavily influenced by the previous bear market.
This phase begins when pessimism is still widespread, even though selling pressure has largely dried up.
Key Characteristics of the Discovery Phase (Expanded Explanation)
Duration – Approximately 25% of the Full Cycle
The Discovery Phase typically represents about a quarter of the entire market cycle. While this may sound significant, it often feels slow and unremarkable to most traders because price movement is still recovering from the previous bear market. Volatility gradually contracts, and price advances tend to be uneven. This phase can last months or even years depending on whether the broader trend is cyclical or secular in nature. Patience is essential during this stage, as the market is laying the foundation for a much larger move later in the cycle.
Accumulation – Smart Money Positions Early
During this phase, institutional investors, hedge funds, and other sophisticated market participants—commonly referred to as smart money—begin accumulating positions quietly. These players typically operate when sentiment is still negative and confidence is low. Because they transact methodically, their buying does not immediately push prices higher in an obvious way. Instead, accumulation occurs within ranges, often after prolonged declines, where supply from discouraged sellers is gradually absorbed.
Trend Emergence – Formation of Higher Highs and Higher Lows
As accumulation progresses, price action slowly begins to change character. The market starts forming a sequence of higher lows, followed by higher highs, signaling that demand is beginning to outweigh supply. These early trend signals are often subtle and easily dismissed as temporary rallies. However, for attentive traders, this shift in market structure is one of the earliest technical signs that a new bull market may be developing.
Shake-outs – Weak Hands Are Removed
One of the defining features of the Discovery Phase is the presence of repeated shake-outs. Early rallies often stall or reverse sharply, creating doubt and frustration among traders. These pullbacks force out weaker hands—participants who lack conviction or proper risk management. While these declines can feel like false starts, they serve a crucial role in strengthening the emerging trend by transferring positions from impatient traders to more committed investors. Once these shake-outs diminish, the foundation for sustained momentum becomes much stronger.
2. The Momentum Phase: Expansion and Trend Confirmation
The Momentum Phase is the stage where the bull market becomes increasingly visible and widely acknowledged. Confidence begins to spread beyond early adopters as price action confirms the emerging trend. Market participation expands steadily, driven by improving fundamentals, stronger technical signals, and growing media attention. During this phase, the trend no longer feels speculative—it starts to look legitimate.
Duration – Roughly 35% of the Full Cycle
This phase typically accounts for the largest portion of the market cycle, often representing around 35% of the total duration. The extended nature of the Momentum Phase reflects the steady and sustainable growth characteristic of a healthy bull market. Price advances tend to unfold in an orderly manner, supported by consistent demand rather than speculative excess.
Broad Participation – Expansion of Market Involvement
As the trend becomes more obvious, participation broadens significantly. Institutional investors continue to add exposure, while swing traders, position traders, and longer-term investors increasingly enter the market. The investor base expands from primarily sophisticated participants to a more diverse group that includes less-experienced traders. This influx of capital helps reinforce the prevailing trend and fuels further price appreciation.
Healthy Sentiment – Optimism Without Excess
Market sentiment during the Momentum Phase is generally positive but remains rational, especially in the early stages. Optimism grows as higher highs and higher lows persist, yet skepticism has not completely disappeared. Traders still respect risk, corrections are expected, and there is little belief that prices will rise indefinitely. This balance between confidence and caution allows the trend to remain structurally sound.
Bear Traps – Corrections That Strengthen the Trend
Pullbacks and corrections are common throughout this phase, but they typically resolve quickly. These temporary declines often appear threatening, leading some traders to anticipate a trend reversal. However, strong underlying demand causes buyers to step in aggressively, turning these pullbacks into bear traps. Rather than signaling weakness, these corrections serve to reset momentum and attract fresh buying interest.
During the Momentum Phase, trends tend to be cleaner and more technically reliable. Volatility remains relatively contained, making price behavior easier to read and manage. Pullbacks are frequently viewed as opportunities to enter or add to positions in the direction of the trend, reinforcing the notion that the market is operating within a healthy, sustainable bullish structure.
3. The Blow-off Phase: Excess, Euphoria, and Instability
The Blow-off Phase represents the final and most intense stage of the bull market. During this period, price action accelerates dramatically as participation reaches its peak. What began as a fundamentally and technically driven trend now becomes fueled largely by emotion. Market behavior grows increasingly unstable, and rational decision-making begins to fade.
Duration – Roughly the Final 10% of the Bull Market
This phase typically accounts for only a small portion of the overall bull market—approximately the last 10%. Despite its short duration, it often produces some of the most dramatic price movements of the entire cycle. Gains that previously took months or years to develop may now occur within weeks or even days, creating a sense of urgency among market participants.
FOMO (Fear of Missing Out) – Surge in Retail Participation
As prices rise rapidly, Fear of Missing Out becomes the dominant emotional driver. Retail traders and late-stage participants enter the market aggressively, often with little regard for valuation or risk. Many of these traders are motivated by recent performance rather than underlying market structure, chasing price simply because it appears to be moving higher.
Media Hype – Reinforcement of Bullish Bias
Mainstream media coverage expands significantly during this phase. Headlines focus on record highs, extraordinary gains, and success stories, reinforcing the prevailing bullish narrative. This constant exposure further amplifies optimism and encourages participation from individuals who may have previously remained on the sidelines.
Euphoria – “This Time Is Different” Mentality
At the height of the Blow-off Phase, market sentiment reaches euphoria. A widespread belief emerges that traditional market rules no longer apply and that prices will continue rising indefinitely. Risk management is often ignored, skepticism disappears, and warnings of overextension are dismissed. This psychological shift marks one of the clearest signals that the cycle is approaching exhaustion.
Smart Money Exits – Quiet Distribution
While enthusiasm among retail participants intensifies, professional investors and institutional traders begin reducing exposure. This process is typically discreet, as large players distribute positions into the surge of buying pressure without disrupting prices immediately. Although prices may continue to rise temporarily, the underlying support from informed capital gradually weakens.
During the Blow-off Phase, price movements can become extreme and increasingly disconnected from fundamentals. In some cases, prices may double or accelerate sharply within a very short time frame. This instability makes the market highly vulnerable, and the phase often concludes abruptly, setting the stage for a rapid and often violent reversal.
Bear Market Phases
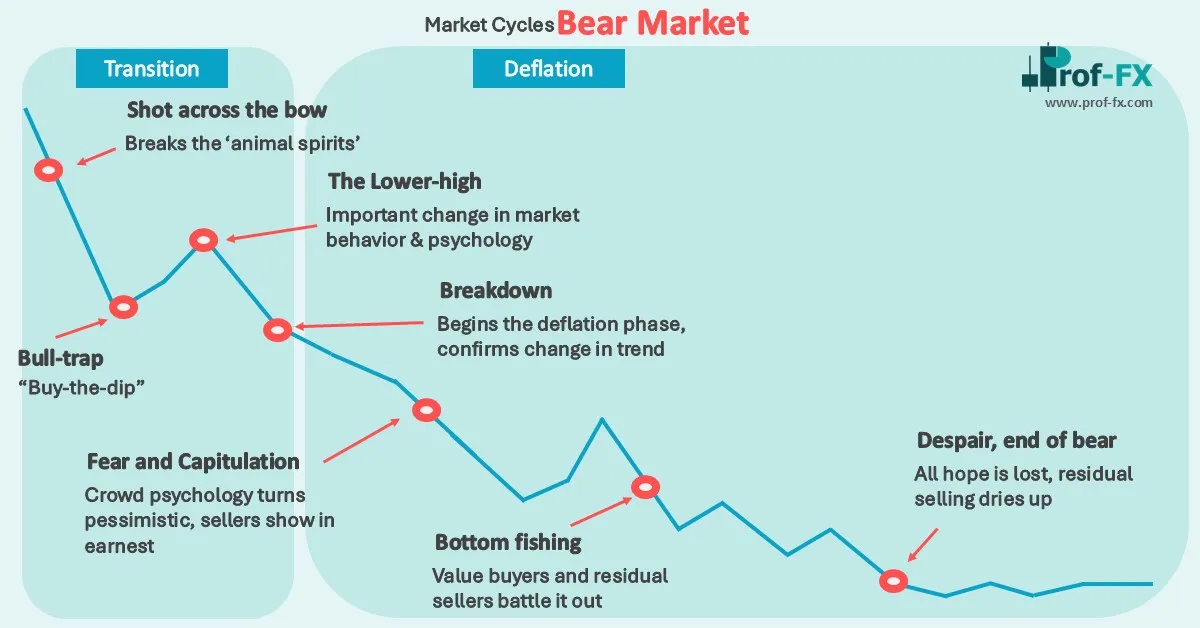
1. The Transition Phase: From Optimism to Uncertainty
The Transition Phase marks a critical turning point in the market cycle, where the dominant bullish trend begins to lose control. Although optimism has not fully disappeared, price behavior starts to change in subtle but important ways. This phase is often difficult for traders to interpret, as emotional bias remains bullish while technical signals begin to deteriorate.
Duration – Roughly 5% of the Total Market Cycle
The Transition Phase typically represents only a small portion of the overall market cycle—approximately 5%. Despite its brief nature, it plays a pivotal role in shifting market psychology. Events unfold quickly, and price action becomes less predictable compared to the orderly behavior seen during the Momentum Phase.
Shot Across the Bow – First Sharp Sell-off
This phase usually begins with a sudden and aggressive decline following the market peak. Often referred to as a “shot across the bow,” this move serves as the first serious warning that bullish momentum is weakening. The speed and intensity of the sell-off catch many participants off guard, disrupting confidence that the uptrend will continue uninterrupted.
Bull Trap – False Sense of Recovery
After the initial decline, the market commonly stages a rebound. This recovery rally restores short-term confidence and convinces many traders that the prior sell-off was merely a healthy correction. However, this rally lacks the strength and follow-through seen earlier in the cycle. Instead of signaling renewed momentum, it sets a bull trap, drawing in buyers just before conditions worsen.
Lower High – Failure to Reach New Highs
A defining technical characteristic of the Transition Phase is the inability of price to make a new high. Buying pressure fades as skepticism increases, resulting in a lower high relative to the prior peak. This shift in market structure signals a loss of trend integrity and highlights a growing imbalance between buyers and sellers.
Breakdown – Key Support Levels Give Way
The phase concludes when previously respected support levels fail. Once price breaks below the prior low established during the initial sell-off, the market confirms a breakdown. This event marks the transition from distribution to a developing bear market, as selling pressure accelerates and sentiment deteriorates further.
The Transition Phase is particularly challenging because optimism still exists, and many traders remain emotionally anchored to the prior bull trend. However, beneath the surface, market behavior has changed. Recognizing these subtle shifts can help traders avoid being caught on the wrong side of the emerging cycle.
2. The Deflation Phase: Capitulation and Market Reset
The Deflation Phase represents the bearish conclusion of the market cycle, where excesses built up during the bull market are systematically unwound. Price action moves decisively lower as confidence erodes and selling pressure dominates. This phase is emotionally challenging, as fear replaces optimism and uncertainty becomes the prevailing sentiment.
Duration – Roughly 25% of the Cycle (Variable in Length)
The Deflation Phase often accounts for approximately 25% of the total market cycle, though its duration can vary significantly. In some cases, this phase unfolds rapidly over months; in others, it can extend over several years. The length depends on the severity of excesses accumulated during the bull market and broader economic conditions.
Fear and Capitulation – Accelerating Selling Pressure
As prices continue to decline, losses accumulate across portfolios, triggering widespread fear. Market participants who once believed in a quick recovery begin to abandon positions. This process culminates in capitulation, where sellers exit not because of analysis, but due to emotional exhaustion and the desire to stop further losses.
Panic Selling – Emotion Overrides Logic
During periods of intense stress, panic selling dominates market behavior. Traders and investors rush to liquidate positions regardless of price, leading to sharp, disorderly declines. Decision-making becomes reactive rather than strategic, and risk management often gives way to survival instincts.
Failed Rallies – Unsuccessful Bottom-Fishing Attempts
Throughout the Deflation Phase, temporary rebounds are common as value-oriented traders attempt to identify a market bottom. However, these rallies typically fail as residual selling pressure quickly overwhelms buying interest. Each failed recovery reinforces bearish sentiment and drives prices to progressively lower levels.
Despair – Extreme Pessimism Sets In
The final stage of the Deflation Phase is marked by deep pessimism and widespread disengagement. Many market participants lose interest entirely, viewing the market as uninvestable. Media narratives turn negative, blame is assigned, and participation dries up. This emotional low often coincides with the exhaustion of selling pressure.
Eventually, as sellers are depleted and prices stabilize, the groundwork for the next Discovery Phase begins to form. Although sentiment remains bleak, this period of despair quietly sets the stage for a new market cycle to emerge.
Why Market Cycles Matter for Traders
Market cycles provide a macro framework that helps traders:
- Avoid buying into euphoric conditions
- Recognize when trends are losing strength
- Adjust risk management based on cycle phase
- Maintain emotional discipline
Cycles remind us that price movement is not random, but a reflection of collective human behavior repeating over time.
Final Thoughts
Market cycles have shaped financial history and will continue to do so. While catalysts change – interest rates, technology, geopolitics—the underlying emotional patterns remain remarkably consistent.
For traders, understanding market cycles is not about predicting tops or bottoms perfectly, but about aligning strategy with context and avoiding the most dangerous psychological traps.
For further study on extreme market events and historical cycles, explore:
A Brief History of Major Financial Bubbles, Crises, and Flash Crashes


