
Understanding Retail Sales: A Core Metric of Consumer-Driven Economic Activity
Retail Sales – often published as the Retail Sales Index (RSI)—is a major economic indicator that reflects the overall health of an economy by capturing monthly consumer spending on retail goods and services. Because consumer demand accounts for a significant share of GDP in most developed economies, RSI helps traders anticipate shifts in broader economic momentum.
Different countries structure their reports slightly differently, but the underlying objective remains the same: to measure changes in household expenditure over a standard period.
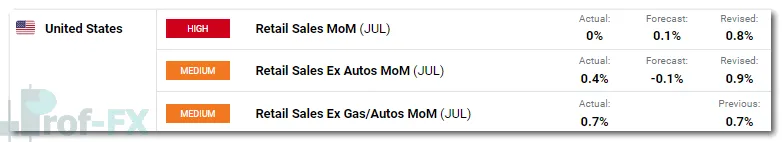
In the United States, one of the most influential components of the retail sales figure is the auto sector, which can be highly volatile. For this reason, the U.S. Census Bureau publishes sub-categories such as:
- Retail Sales Ex Autos
- Retail Sales Ex Gas/Autos
- Sometimes referenced as Core Retail Sales
These exclusions allow analysts and traders to monitor underlying demand without distortions from unusually strong or weak vehicle sales.
Because consumer spending drives corporate revenue, employment trends, and policy decisions, tracking monthly RSI results is crucial for traders, investors, and economists. Strong retail spending generally signals economic expansion, potentially increasing foreign investment inflows. It also influences related macro indicators such as:
- Durable Goods Orders
- Consumer Confidence Index
- Balance of Trade
- Gross Domestic Product (GDP)
- Inflation via Consumer Price Index (CPI)
How Retail Sales Are Measured: Key Categories Inside the U.S. RSI
The U.S. Retail Sales Index includes a broad array of retail categories (Source: U.S. Census Bureau), such as:
- Motor vehicle and parts dealers
- Furniture and home furnishings
- Electronics and appliance stores
- Building materials and garden supply dealers
- Food and beverage stores
- Health and personal care retailers
- Gasoline stations
- Clothing and accessories
- Sporting goods, books, and hobby stores
- General merchandise stores
- Miscellaneous retailers
- Non-store retailers (e-commerce)
- Food services and drinking places
Each segment is weighted based on a sampling framework that is periodically updated by the Census Bureau to ensure accuracy and relevance.
Retail Sales and Inflation: Understanding the Real Purchasing Power Behind the Numbers
Traders must interpret retail sales figures cautiously, especially during periods of high inflation. RSI values are not adjusted for inflation, meaning that nominal increases in retail sales may not represent real growth.
For example:
A positive retail sales report could still reflect a decline in actual consumer purchasing power once adjusted for CPI inflation.
When inflation rises, each dollar buys fewer goods. As a result, a retail sales increase may simply mean households are paying more for the same items—rather than purchasing more products.
This distinction is critical because it affects:
- Consumer spending behavior
- Corporate revenue expectations
- Central bank policy responses
- Market sentiment across asset classes
How Traders Use Retail Sales Data: Market-by-Market Breakdown
Retail sales can influence nearly every major asset class. Understanding its impact helps traders anticipate volatility and identify trading opportunities.
1. Retail Sales and the Stock Market: A Positive Correlation With Corporate Earnings
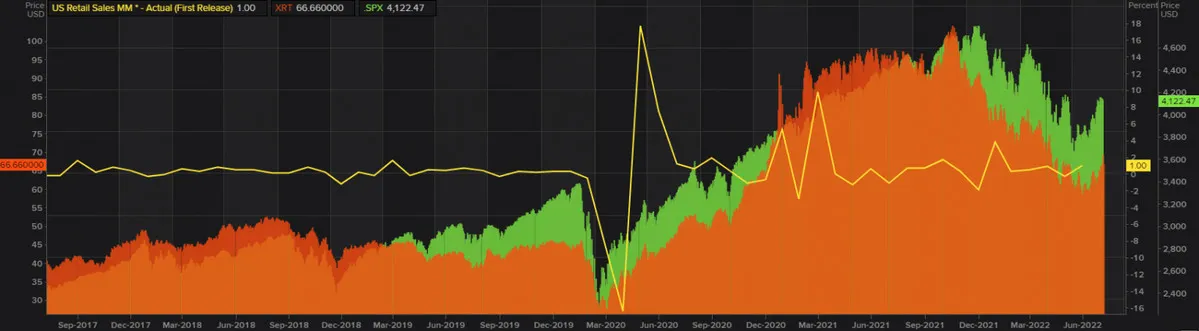
Retail Sales typically show a positive relationship with equity markets, particularly consumer-focused sectors. Higher retail spending generally supports stronger corporate earnings, which in turn drives stock prices higher.
The chart below illustrates how U.S. retail sales correlate with:
- S&P 500 Index (SPX)
- SPDR S&P Retail ETF (XRT)
U.S. RETAIL SALES VS S&P500 INDEX VS SPDR RETAIL ETF (2017–2022)
Since auto sales contribute heavily to the U.S. retail sales figure (roughly 20%), analysts often look to the automotive sub-category for insights into the performance of key public companies. Below is a comparison between U.S. retail sales and two major automakers:
- Ford Motor Company (F)
- General Motors Company (GM)
U.S. RETAIL SALES VS FORD MOTOR CO. & GENERAL MOTORS CO. (2012–2022)
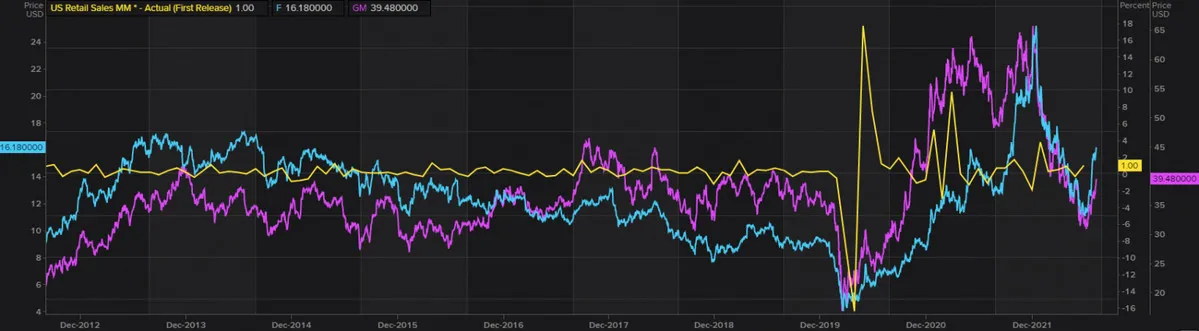
This correlation allows equity traders to anticipate earnings trends or identify sector-specific trading setups.
2. Retail Sales in the Forex Market: Impact on Currency Strength and Central Bank Policy
In foreign exchange markets, strong retail sales data often benefits the home currency. The logic is straightforward:
- Higher retail sales → stronger economic outlook → potential monetary tightening → stronger currency
- Lower retail sales → weaker outlook → potential rate cuts → weaker currency
In the U.S., retail sales figures can influence expectations for Federal Reserve interest rate decisions. Traders frequently monitor RSI results because they can shift market sentiment rapidly, especially in USD pairs like EUR/USD, USD/JPY, GBP/USD, and commodity currencies.
The chart below highlights the six-month relationship between U.S. Retail Sales and the Dollar Index (DXY):
U.S. RETAIL SALES VS DXY (2022)
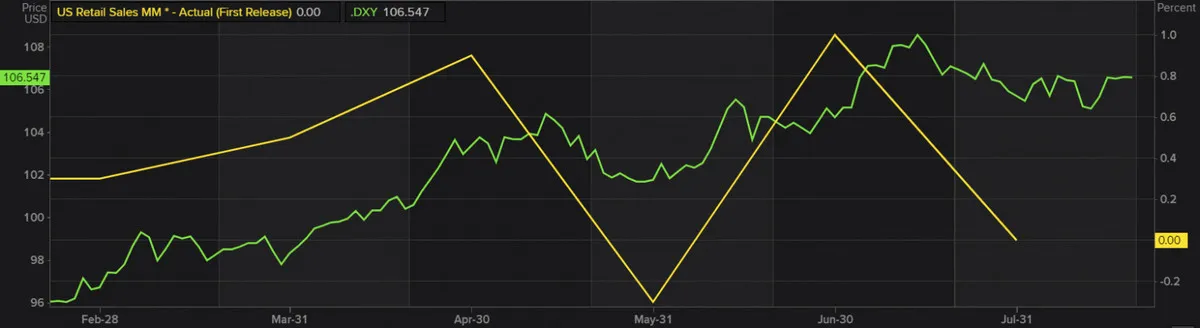
A clear positive correlation is visible—though, as always, traders must consider other macroeconomic factors such as inflation, employment data, and geopolitical conditions.
Summary: Why Retail Sales Remain a Key Indicator for All Traders
Retail Sales is a versatile and powerful economic indicator that helps traders across all strategies—from day traders to macro analysts—understand shifts in economic momentum.
Here’s why RSI is indispensable:
- It reveals real-time changes in consumer behavior
- It influences central bank decision-making
- It impacts stocks, forex, commodities, and fixed income markets
- It acts as a leading gauge for corporate earnings
- It provides insights into inflation-adjusted spending trends
Whether you rely primarily on technical analysis or prefer a fundamentally driven strategy, integrating retail sales into your market assessment can significantly improve your understanding of price movements and macroeconomic cycles.
")


