Woodie CCI Manual

Forex Ebook - Woodie CCI Manual .Pdf

Synopsis E-book: Woodie CCI Manual

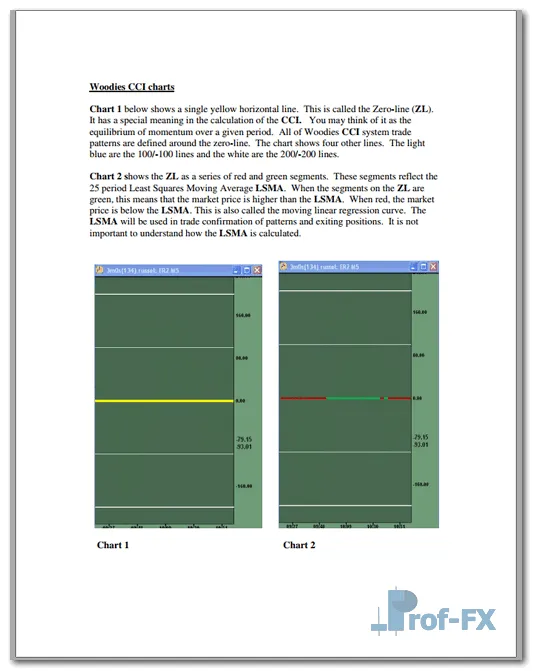
Chart 1 below shows a single yellow horizontal line. This is called the Zero-line (ZL). It has a special meaning in the calculation of the CCI. You may think of it as the equilibrium of momentum over a given period. All of Woodies CCI system trade patterns are defined around the zero-line. The chart shows four other lines. The light blue are the 100/-100 lines and the white are the 200/-200 lines.
Chart 2 shows the ZL as a series of red and green segments. These segments reflect the 25 period Least Squares Moving Average LSMA. When the segments on the ZL are green, this means that the market price is higher than the LSMA. When red, the market price is below the LSMA. This is also called the moving linear regression curve. The LSMA will be used in trade confirmation of patterns and exiting positions. It is not important to understand how the LSMA is calculated.


Preview Woodie CCI Manual

Forex Ebook - Woodie CCI Manual .Pdf Forex Ebook - Woodie CCI Manual .Pdf Forex Ebook - Woodie CCI Manual .Pdf

Download E-book Woodie CCI Manual

  • Woodie CCI Manual.pdf
  • Size: 610 kb
  • Author: James L. O’Connell | Language: English | Dir.: Part2 | Request Remove!
Gravatar Image
FX Script is a collective of skilled forex traders with extensive knowledge of MetaTrader indicators. Known for their expertise, they regularly contribute to Prof FX, offering practical trading tips and advanced strategies to guide traders towards success in the forex market.

Leave a Reply

Your email address will not be published. Required fields are marked *

How to Trade Shooting Star Candlestick Patterns in Forex

Japanese candlestick analysis remains one of the most widely used technical tools in forex trading, and among its many formations,

Using the Harami Candlestick Pattern for Reversals

Like most candlestick formation patterns, the Harami tells a clear story about real-time market sentiment. Once the signal candle completes,

Using Fibonacci Retracements in Forex Trading

Why Support and Resistance Matter in Trading Decisions One of the most important foundations of market analysis – whether in

Differences Between Fundamental and Technical Analysis

Understanding the Differences Between Fundamental and Technical Analysis in Forex Trading In the forex market, traders commonly rely on two

Floor Trader Pivot Points

Floor-Trader Pivots are a classic and highly respected technical tool used by professional traders to identify potential price reaction zones.

Top 5 Reasons Backtesting Is The Ultimate Skill

“I’m close to going live with my system! It works perfectly!” – “Great! Have you backtested your system?” “What’s backtesting?”

What Are Currency Cross Pairs in Forex Trading

Key Talking Points for New Traders Foreign exchange rates are always quoted in currency pairs Major pairs combine a major

Best Forex Trading Time Frames Explained

One of the most common questions I hear from new traders is: “What is the best time frame to trade