
Supply and demand and support and resistance are two closely related concepts that often confuse newer traders. While they share similarities and are sometimes used interchangeably, they are not the same thing. Understanding the distinction—and more importantly, learning how to combine them—can significantly improve trade timing and decision-making.
In this section, I’ll explain the core differences between supply and demand vs support and resistance, then show you how professional traders use support and resistance as a practical framework to trade supply and demand zones, especially for range-bound and breakout market conditions.
Supply and Demand vs Support and Resistance: What’s the Difference?
At a surface level, both concepts describe areas where price has difficulty moving beyond a certain point. However, the way they are defined and applied in real trading is fundamentally different.
Support and Resistance: Precise Price Levels
Support and resistance are typically identified as specific price levels where price has repeatedly failed to break through. These levels are easy to visualize and are commonly used by traders at all experience levels.
- Support: A price level where buying pressure historically outweighs selling pressure
- Resistance: A price level where selling pressure historically outweighs buying pressure
Support and resistance work well as reference points, but relying on them alone can be limiting because markets rarely reverse at an exact price.
Supply and Demand: Broader Price Zones
Supply and demand, on the other hand, are defined as broader price regions or zones, not single lines. These zones represent areas where large imbalances between buyers and sellers previously occurred—often driven by institutional participation.
- Demand zones: Areas where buying interest significantly exceeded selling
- Supply zones: Areas where selling pressure overwhelmed buying interest
Because they reflect deeper market mechanics, supply and demand zones often provide more flexibility and realism in volatile markets.
Key Differences at a Glance
| Supply and Demand | Support and Resistance |
| Represented by broad price zones | Defined by a specific price level |
| Reflect institutional order flow | Reflect repeated retail reactions |
| Easier to find trade entries | Harder to base precise decisions |
| More adaptable to volatility | More rigid in fast markets |
From a professional perspective, support and resistance help traders visualize structure, while supply and demand explain why that structure exists.
How to Use Support and Resistance to Trade Supply and Demand
Rather than choosing one concept over the other, experienced traders often combine both approaches. Support and resistance act as a framework, while supply and demand provide depth and context.
Before placing any trade, traders must first assess the market environment:
- Is the market likely to remain stable?
- Or is a major change expected due to volatility, news, or macroeconomic events?
This assessment determines whether traders should focus on range trading or breakout trading.
Trading Supply and Demand in Range-Bound Markets
Trading the Range: Buy Low, Sell High
When markets are relatively stable, price often oscillates between well-defined support and resistance areas. In this environment, traders expect supply and demand zones to hold, allowing price to respect previous boundaries.
In range trading:
- Traders look to buy near demand (support)
- Traders look to sell near supply (resistance)
Price action alone can reveal where demand begins to outweigh supply, pushing prices higher, or where supply overwhelms demand, forcing prices lower.
Example: Trading a Range in GBP/USD
In the chart below, repeated reactions near the lower boundary highlight a demand zone, while failures near the upper boundary confirm a supply zone.
GBP/USD range trading example:
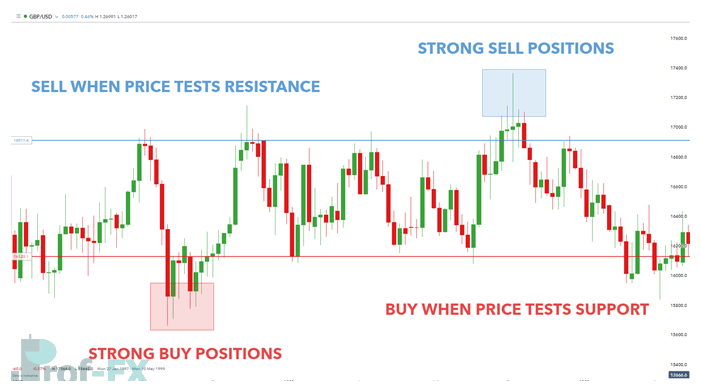
This approach aligns with the classic trading principle: “buy low and sell high”, while using supply and demand to add realism beyond a single price line.
Trading Supply and Demand in Breakout Markets
Trading the Breakout: When the Environment Changes
The opposite scenario occurs when traders expect the market environment to shift rapidly. This often happens due to:
- High-impact economic data (NFP, CPI, interest rate decisions)
- Central bank communication (Federal Reserve, ECB, BOE)
- Political or geopolitical events
In breakout trading, supply or demand zones are overpowered, leading to new highs or new lows.
Instead of buying low and selling high, traders adjust their mindset:
- Buy high and sell at an even higher price
- Sell low and buy back at a lower price
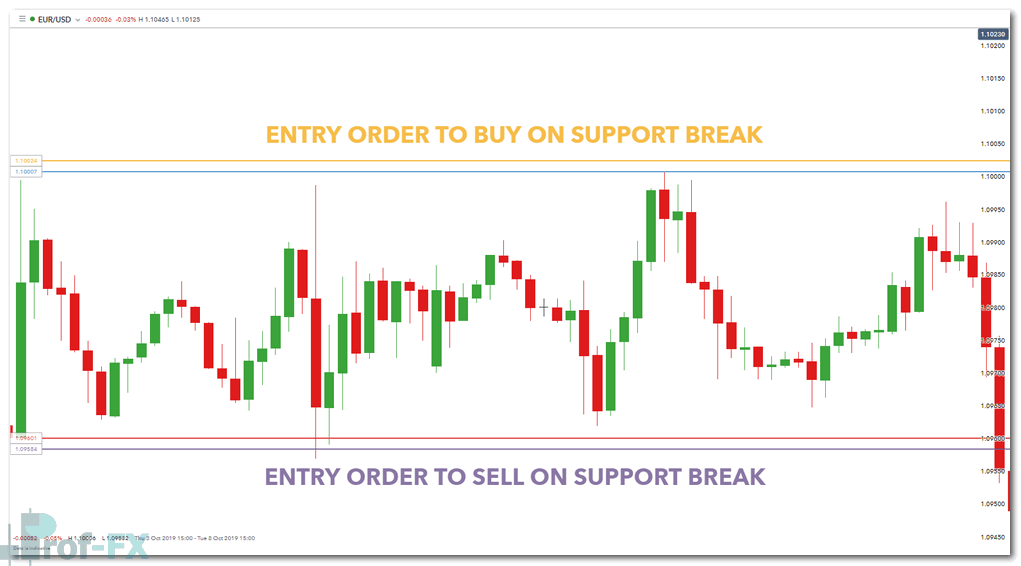
Example: Breakout Trading in EUR/USD
The chart below illustrates a clean break above resistance, where former supply fails and price accelerates into a new demand imbalance.
EUR/USD breakout trading example:
Because breakout environments are often fast-moving and emotionally charged, false signals are more common. This is why professional traders adapt their risk management accordingly.
Risk Management When Trading Supply and Demand
Risk Management During Breakout Conditions: What Traders Must Adjust
Breakout trading offers strong profit potential, but it also introduces a fundamentally different risk environment compared to range-bound markets. When price breaks through a major supply or demand zone, market behavior often becomes faster, less predictable, and more emotionally driven. Understanding these conditions is critical before committing capital.
Why Breakout Markets Carry Higher Risk
Breakout conditions typically come with higher volatility, meaning price moves more aggressively in a short period of time. This volatility is often driven by:
- High-impact economic releases (CPI, NFP, interest rate decisions)
- Central bank policy shifts (Federal Reserve, ECB, Bank of England)
- Unexpected geopolitical or political developments
- Sudden changes in market sentiment and liquidity
As volatility increases, price swings widen, causing candles to expand rapidly and intraday ranges to stretch beyond normal expectations. In these conditions, price can overshoot technical levels, reverse sharply, or trigger stop-loss orders before continuing in the original direction.
This directly leads to increased stop-loss risk, as tighter stops that work well in range trading are more likely to be hit during breakouts. Even well-placed stop-loss orders can be vulnerable to short-term spikes, commonly referred to as stop hunts or liquidity sweeps.
How Professional Traders Adapt Their Risk Management
Because breakout environments behave differently, experienced traders do not trade them with the same parameters used in stable markets. Instead, they make deliberate adjustments to protect capital and preserve long-term consistency.
Reducing Position Size
One of the first adjustments professionals make is reducing position size. By trading smaller lot sizes, traders limit the financial impact of increased volatility. This allows them to stay involved in the market without exposing their account to excessive drawdowns caused by sudden price fluctuations.
In practical terms, this means:
- Risking the same percentage of capital per trade
- Accepting wider stop-loss distances
- Compensating by lowering trade volume
Widening Stop-Loss Levels
In breakout conditions, wider stop-loss levels are often necessary to account for erratic price behavior. Stops placed too close to entry are more likely to be triggered by normal breakout volatility rather than genuine trend failure.
Professional traders place stop-loss orders:
- Beyond key supply or demand zones
- Outside of obvious support or resistance levels
- Where the original breakout thesis is clearly invalidated
This approach helps traders avoid being prematurely stopped out while still maintaining defined risk.
Avoiding Overleveraging
Perhaps the most critical adjustment during breakout trading is avoiding overleveraging. High leverage combined with high volatility is one of the fastest ways to deplete a trading account.
In fast-moving markets:
- Margin requirements can change rapidly
- Slippage becomes more common
- Emotional decision-making increases
Experienced traders treat leverage as a tool, not a necessity, and often reduce exposure during breakout events to maintain psychological control and execution quality.
The Professional Mindset: Survival Before Profit
From both a professional trading and academic risk-management perspective, breakout trading is less about maximizing profit and more about preserving capital during unstable conditions. Traders who survive volatile phases are the ones positioned to benefit once the market stabilizes.
For developing traders, the key takeaway is simple:
If volatility increases, risk must decrease.
By adjusting position size, stop placement, and leverage, traders align themselves with professional risk management principles—turning breakout trading from a high-risk gamble into a controlled, strategic opportunity.
Final Thoughts: Using Structure to Understand Market Forces
Support and resistance provide structure, while supply and demand explain the underlying forces driving price movement. When used together, they offer traders a more complete and realistic view of the market.
For beginner traders, this combined approach:
- Improves market context
- Reduces false entries
- Encourages disciplined decision-making
Over time, understanding where supply and demand exist—and how price reacts around support and resistance—becomes a powerful foundation for consistent forex trading.
Further Reading
- Deepen your understanding of supply and demand zones and how price imbalances form
- Explore practical ways traders apply support and resistance across global financial markets


