
Have you ever closed a position only to watch the currency pair continue running another 100 pips in the same direction – leaving you frustrated and questioning your strategy? You’re certainly not alone. Countless traders experience this scenario, often because they exit too early or lack a clear method to evaluate trend strength. In this article, we’ll explore how the Heiken-Ashi indicator, a powerful but often overlooked tool, can help traders stay aligned with strong directional moves and avoid premature exits.
Why Many Traders Exit Too Early: The Confidence Gap in Trading Plans
Throughout our online trading courses and live coaching sessions, we’ve noticed a recurring theme: traders feel overwhelmed by what appear to be random market movements. One of the most popular questions we receive is, “Where is the best place to exit?” This frustration is almost always rooted in the absence of a structured trading plan—a roadmap that provides clarity, consistency, and confidence.
“Every battle is won before it is ever fought.” – Sun Tzu
This quote is especially relevant in forex trading. Without preparation and defined rules, traders rely on emotions rather than strategy.
What Thousands of Trades Revealed About Trader Behavior
After analyzing 1 thousands live trades across various forex pairs, our research highlighted a critical behavioral pattern distinguishing successful traders from unsuccessful ones:
Losing traders tend to hold on to losing positions far longer than their winning trades.
This behavior reflects uncertainty, lack of discipline, and insufficient confidence in one’s trading plan.
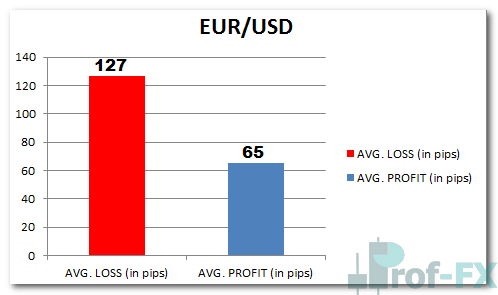
For example, when examining EUR/USD trades over a full year, we discovered that traders closed their losing positions at an average of 127 pips, nearly double the 65-pip average profit they secured on winning trades.
When expanding our research across all major and minor pairs, the discrepancy became even more evident:
- Average profit: 52 pips
- Average loss: ~double that amount
This shows that traders consistently cut winners too early while allowing losses to grow—one of the most common pitfalls among retail traders.
Introducing the Heiken-Ashi: A Smarter Way to Read Market Direction
One effective solution to this problem is the Heiken-Ashi indicator, a modified version of traditional Japanese candlesticks designed to smooth out price action and highlight underlying trend momentum.
Unlike standard candles, the Heiken-Ashi recalculates the open and close using average values, filtering out short-term noise and providing a more balanced representation of price behavior.
Heiken-Ashi Formula
The calculation modifies only the open and close:
- Close = (Open + High + Low + Close) / 4
- Open = [Open(previous bar) + Close(previous bar)] / 2
- High = Max(High, Open, Close)
- Low = Min(Low, Open, Close)
This smoothing effect produces candles that many traders find easier to interpret, especially during trending markets.
Two Key Benefits: Clear Trend Direction and Trend Strength
1. Clear Visual Trend Direction
Heiken-Ashi candles use color coding to help traders quickly identify trend direction:
- Blue candles indicate an upward trend
- Red candles reflect a downward trend
This makes directional bias easier to read compared to regular Japanese candlesticks, especially during volatile periods.
2. Identifying Trend Strength Through Candle Wicks
Another advantage of Heiken-Ashi is its ability to signal momentum.
A strong trend often shows no wick on the opposite side of the candle.
This happens because the average-based calculation “compresses” counter-movement noise, making strong trends visually cleaner. When you see consecutive candles without a lower wick (in an uptrend) or upper wick (in a downtrend), it typically reflects strong directional momentum—a compelling reason to stay in your trade.
Practical Use: Staying in Trades with More Confidence
When you’re uncertain about whether to exit a trade, analyzing the Heiken-Ashi candle’s wick can provide clarity. If the indicator continues to show momentum in your favor—especially without opposing wicks—you can remain in the position with greater confidence.
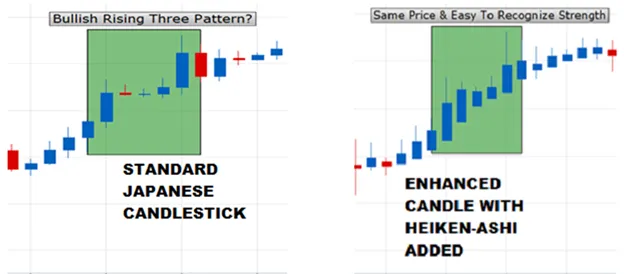
For instance, a trader relying only on standard Japanese candlesticks (left side) might become confused by consolidation or small counter-trend movements and exit too early. On the other hand, the Heiken-Ashi chart (right side) often presents cleaner trend signals. A series of blue candles with no lower wicks clearly indicates that the uptrend remains strong, giving traders the confidence to stay in their buy positions longer.
Final Thoughts
The Heiken-Ashi indicator is not a magic solution, but it is a remarkably effective tool for enhancing trend-following strategies and reducing emotional decision-making. By smoothing price action and providing clear visual cues, Heiken-Ashi helps traders avoid premature exits and stay aligned with strong market movements.
Whether you’re a new trader or an experienced one looking to refine your exit strategy, integrating the Heiken-Ashi into your trading plan can significantly improve your ability to capitalize on extended trends.
Good luck, and happy trading.


