
Why Support and Resistance Matter in Trading Decisions
One of the most important foundations of market analysis – whether in forex trading or indices trading – is the concept of support and resistance. These levels give traders a practical “line in the sand” that helps define where a trade idea is valid and where it is no longer worth holding.
When a trader holds a bullish bias in a market – whether derived from fundamental analysis, macroeconomic themes, or longer-term technical trends – support levels become especially valuable. They allow traders to control risk, rather than chasing price higher and reacting emotionally. This is where Fibonacci retracements can play a powerful role.
Fibonacci retracements are among the most widely used tools for identifying potential support and resistance zones, and in this article, we will explore a simple and practical way to apply them across both forex pairs and equity indices.
Technical Analysis as a Risk Management Tool
The world of market analysis is filled with indicators, systems, and strategies—all offering different ways to determine what to trade and how to trade it. However, one lesson traders often learn early is that trading is far more about probability than prediction.
Most forms of technical analysis focus on interpreting past price behavior to gain clarity about current market conditions. While trends may sometimes continue in familiar ways, the greatest benefit of technical analysis is not forecasting—it is risk management.
This conclusion is reinforced by findings from the Prof FX Traits of Successful Traders research, which shows that consistently “out-guessing” the market is not a requirement for success. Instead, poor risk management can negate even a favorable win rate.
This is precisely where support and resistance become invaluable. These levels provide a structure that traders can use to frame trades logically and manage risk efficiently.
Using Support and Resistance to Reduce Emotional Trading
Consider a trader who is bullish on EUR/USD but struggles with trade timing. Rather than chasing price higher due to FOMO (Fear of Missing Out), the trader can wait patiently for price to pull back into a support zone.
At that point, the trader can implement a simple if–then framework:
- If the market remains bullish and price respects support,
then the trader can stay in the position with confidence. - If support fails,
then the trade can be exited quickly to limit losses.
This approach removes emotion and replaces it with structure—one of the defining characteristics of professional trading.
How to Identify Support and Resistance Using Fibonacci
There are countless ways to identify support and resistance, ranging from basic horizontal levels to complex multi-indicator systems. Fibonacci retracements may appear advanced at first glance, but in practice, they are quite simple.
The Fibonacci sequence begins as follows:
1, 1, 2, 3, 5, 8, 13, 21, 34, 55, 89, 144, 233, 377, 610, 987, 1597…
Each number is the sum of the two preceding numbers, continuing infinitely. What makes this sequence special are the mathematical relationships within it.
The most well-known of these relationships is 1.618, known as Phi or the Golden Ratio. This ratio appears frequently in architecture, art, and nature—from spiral patterns in pinecones to biological growth cycles.
Key Fibonacci Retracement Levels Explained
For traders, the relevance of Fibonacci lies in the percentage relationships between numbers in the sequence.
- 8% retracement:
Each number is approximately 61.8% of the next number (e.g., 34 ÷ 55 ≈ 0.618). - 2% retracement:
Dividing a number by the one two places to the right produces 38.2%. - 6% retracement:
Dividing a number by the one three places to the right yields 23.6%.
These relationships produce the most commonly used Fibonacci retracement levels: 23.6%, 38.2%, and 61.8%.
Together, they form potential zones of support and resistance based on a prior major price move.
GBP/USD Weekly Chart: Fibonacci Applied to the Brexit Move
Going Further: The 50% and 78.6% Levels
If you have used Fibonacci retracements before, you may have noticed additional levels that are not technically part of the Fibonacci sequence.
The 50% retracement is simply the midpoint of the move. While it has no Fibonacci origin, it is widely respected in the market and often acts as a psychological balance point.
Another important level is 78.6%, which is derived from the square root of 61.8%. This level is often monitored for deep retracements and potential reversal scenarios, particularly when price approaches the prior high or low of a major move.
How to Trade Fibonacci Support and Resistance
Fibonacci retracement levels should be treated like any other support or resistance zone: they are potential levels until price reacts to them.
Once price approaches a Fibonacci level, traders can again apply the if–then framework:
- If support holds, the trade idea remains valid.
- If support breaks, the trade should be exited quickly to limit risk.
One advantage of Fibonacci retracements is their flexibility. Traders can apply them to:
- Long-term charts for macro-level positioning
- Swing trading setups on daily charts
- Short-term intraday strategies
Practical Example: GBP/USD and the Brexit Move
To apply a Fibonacci retracement, traders first identify a major price move, then draw the retracement from the start of the move to its end.
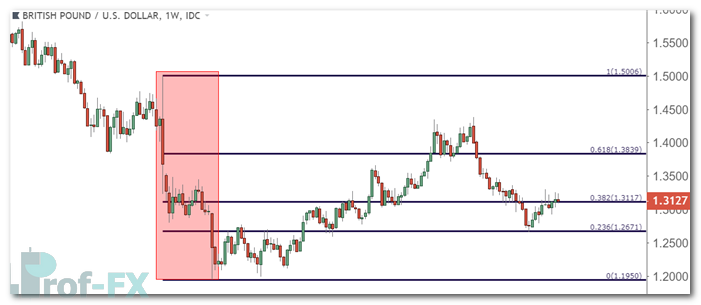
In the example below, a Fibonacci retracement is applied to GBP/USD, using the June 2016 high at 1.5006 and the October 2016 low near 1.1950, following the Brexit-driven sell-off.
GBP/USD Weekly Price Chart
Even years later, these retracement levels continue to influence price action. Recent short-term support has developed near the 38.2% retracement around 1.3117, following a strong bullish reaction from the 23.6% level earlier in the year.
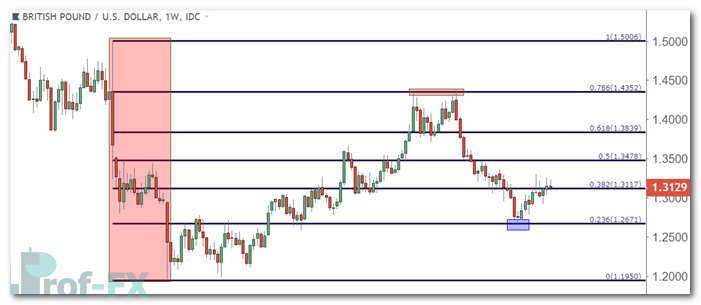
Earlier in April, the 78.6% retracement near 1.4350 acted as strong resistance, contributing to a double-top formation before a major reversal occurred.
Fibonacci Structure During the GBP/USD Recovery
During much of 2017, as GBP/USD recovered from the Brexit decline, price action respected this Fibonacci framework. Resistance at one retracement level often turned into support at the next, reinforcing the usefulness of Fibonacci as a structural tool.
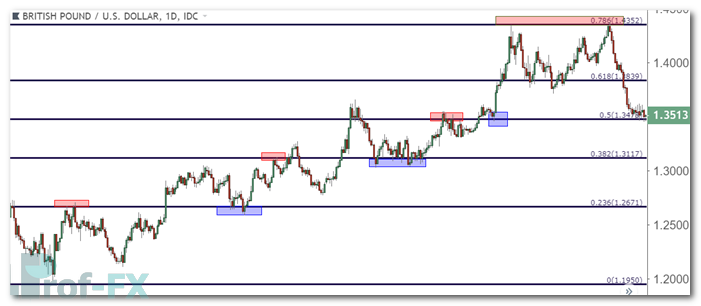
GBP/USD Daily Price Chart: Bullish Structure
Applying Fibonacci to Equity Indices
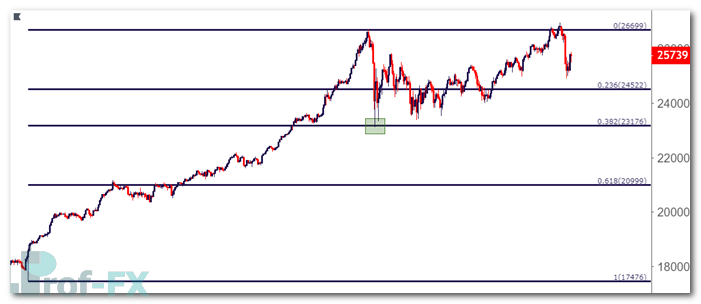
Fibonacci retracements are not limited to forex markets. They are also widely used in equity indices such as the Dow Jones Industrial Average.
During the early-year correction in US equities, price retraced approximately 38.2% of the post-2016 election rally before finding support.
Dow Jones Daily Price Chart: 38.2% Retracement
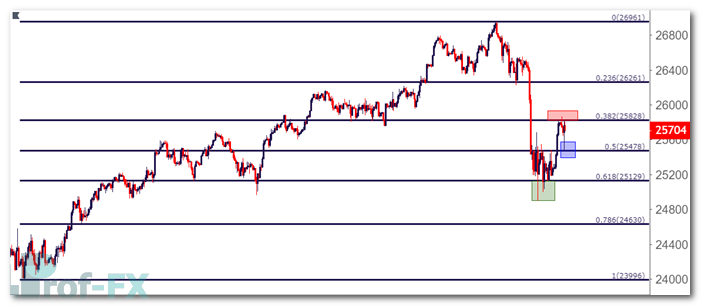
On a shorter-term basis, a more recent sell-off retraced 61.8% of the prior bullish trend, with intraday support and resistance forming near the 50% and 38.2% levels.
Dow Jones Four-Hour Price Chart
Fibonacci as a Framework, Not a Prediction Tool
Fibonacci retracements do not predict the future. Instead, they provide a framework for managing risk, defining trade invalidation, and maintaining discipline.
When used correctly—alongside proper position sizing and risk management—Fibonacci retracements can help traders trade with clarity rather than emotion.
That is ultimately what separates consistent traders from those who struggle: not superior predictions, but superior structure.


