
The Stochastic Oscillator is one of the most widely used momentum indicators in technical analysis, particularly among forex traders seeking to assess trend strength and market momentum. At first glance, stochastic signals appear simple – clear overbought and oversold zones with apparent buy and sell cues. However, relying on these signals without understanding how the indicator behaves in different market conditions often leads to frustration.
To avoid common mistakes, especially for newer traders, it is essential to understand the mechanics behind the stochastic oscillator and how it should be interpreted within the context of trend direction, volatility, and market structure.
What Is the Stochastic Oscillator?
The stochastic oscillator is a momentum-based technical indicator that measures whether the current price of a financial instrument is trading near the upper or lower boundary of its recent price range. Instead of focusing on absolute price levels, the stochastic compares the most recent closing price to the high–low range over a specified lookback period.
In essence, the indicator answers a simple but powerful question:
Is price closing near the highs or near the lows of its recent range?
This makes the stochastic oscillator particularly useful for identifying overbought and oversold conditions, especially in ranging or consolidating markets.
Stochastic Oscillator Example on a Price Chart
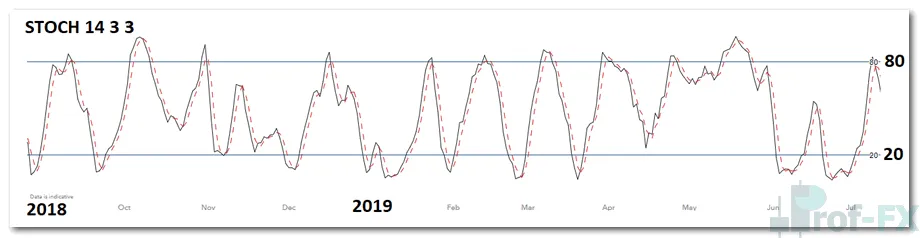
How the Stochastic Oscillator Works
The stochastic oscillator consists of two oscillating lines that move between two horizontal boundaries—typically set at 0 and 100.
- The %K line (usually shown as a solid line) represents the raw momentum reading.
- The %D line (commonly displayed as a dotted line) is a 3-period simple moving average of the %K line, used to smooth price fluctuations.
When both lines rise above the 80 level, the market is considered overbought.
When both lines fall below the 20 level, the market is considered oversold.
These levels are not reversal signals by themselves; rather, they indicate that price is trading near an extreme relative to its recent range.
Understanding Overbought and Oversold Levels
The overbought zone represents price levels that fall within the top 80% of the recent price range, based on the selected lookback period—commonly 14 periods by default.
Likewise, the oversold zone represents price levels within the bottom 20% of the recent range.
It is important to understand that:
- Overbought does not automatically mean price will fall
- Oversold does not guarantee an immediate rally
Instead, these zones highlight potential areas of interest where traders should look for confirmation using price action or trend context.
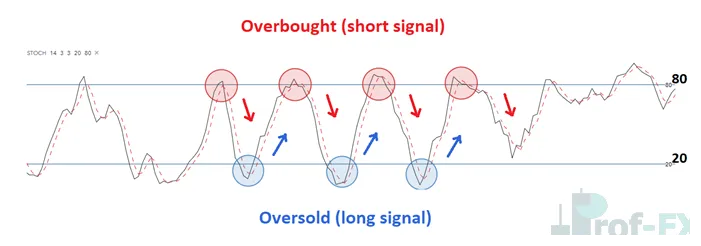
Using the Stochastic Oscillator to Time Entries
One of the strongest applications of the stochastic oscillator is entry timing, particularly when aligned with the dominant trend.
A common approach is:
- Bearish setup: When both lines are above 80 and the %K line crosses below the %D line, this may signal a short opportunity.
- Bullish setup: When both lines are below 20 and the %K line crosses above the %D line, this may indicate a potential long opportunity.
These crossover signals become significantly more reliable when they occur in the direction of the prevailing trend.
Stochastic Oscillator Entry Signal Example
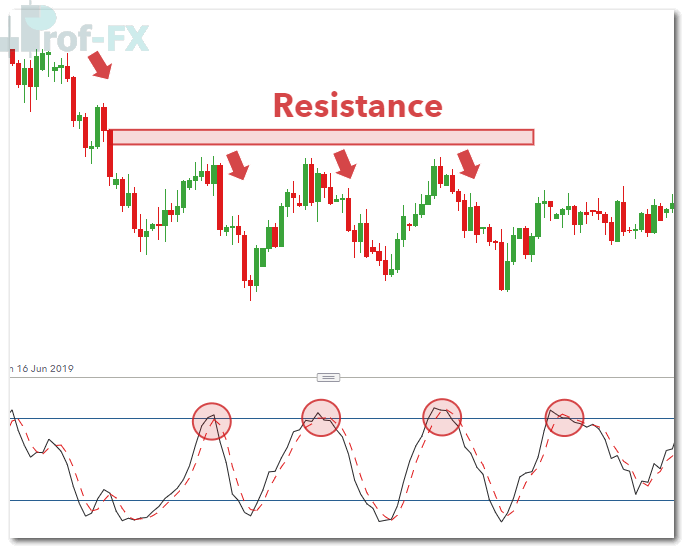
Why Trend Context Is Critical
One of the most common mistakes traders make is blindly trading overbought or oversold signals without considering trend direction.
For example, in a clearly defined downtrend, such as the USD/SGD scenario shown below, traders should prioritize:
- Short entries at overbought levels
- Ignoring oversold signals until the trend structure changes or price enters a clear range
Long trades from oversold conditions make more sense only when:
- The trend reverses, or
- The market transitions into a well-defined sideways range
USD/SGD Chart with Stochastic and Trend Context
Stochastic Oscillator Formula Explained
The stochastic oscillator is calculated using a mathematical formula that compares the latest closing price to a defined price range.
Formula for %K (14-period example)
%K = [(C − L14) / (H14 − L14)] × 100
Where:
- C = Latest closing price
- L14 = Lowest low over the lookback period
- H14 = Highest high over the lookback period
Formula for %D
%D = 3-period simple moving average of %K
While 14 periods is the default setting, traders can adjust this value to suit different timeframes or trading styles.
Advantages and Limitations of the Stochastic Oscillator
Understanding both the strengths and weaknesses of the stochastic oscillator helps traders apply it more effectively.
Advantages
The stochastic oscillator offers:
- Clear and frequent entry and exit signals
- Strong performance in ranging or consolidating markets
- Broad availability across most trading platforms
- An intuitive, easy-to-understand structure for beginners
Limitations
However, traders should be aware that:
- False signals are common when used without trend confirmation
- Markets can remain overbought or oversold for extended periods
- Trading against strong trends often leads to premature entries
Key Takeaways for Using the Stochastic Oscillator
The stochastic oscillator is a powerful tool for identifying momentum extremes over a specific time horizon. It is especially effective when price itself is oscillating within a defined range, making overbought and oversold readings more meaningful.
That said, the indicator should never be used in isolation. Traders must always account for:
- Overall trend direction
- Market structure
- Key support and resistance levels
Used correctly, the stochastic oscillator enhances timing—not prediction.
Related Indicators and Learning Resources
For traders seeking to expand their technical toolkit, several oscillators complement the stochastic indicator:
- Relative Strength Index (RSI): Also identifies overbought and oversold conditions, but uses a different calculation methodology.
- Commodity Channel Index (CCI): Measures statistical deviation from the mean and typically oscillates between +100 and −100.
- Moving Averages: Useful for defining trend direction and filtering stochastic signals.
If you are just starting your trading journey, be sure to visit our Forex Trading Course, designed to build a strong foundation in currency markets.
Prof FX delivers ongoing forex news, macroeconomic insights, and technical analysis focused on the forces shaping global currency markets.


