


Synopsis E-book: Point And Figure Charting
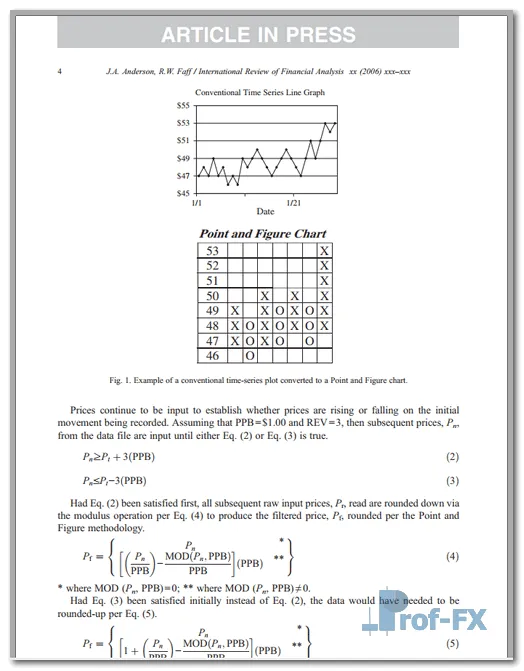
Point and Figure charting is a technical analysis technique in which time is not represented on the x-axis, but merely price changes (independent of time) are recorded via a series of ‘X’s for increasing price movements and ‘O’s for decreasing price movements. Trading rules are then defined over particular patterns in the ‘X’s and ‘O’s—somewhat analogous to conventional charting. As such, ‘Point and Figure’ concentrates solely on changes in asset prices, regardless of the time required to produce such price movements. This means that data, particularly ultra-high-frequency data, can be considerably condensed by discarding small price changes, while still capturing user-determined levels of ‘material’ price changes on a continuous basis.
Preview Point And Figure Charting
 |
 |
 |
Download E-book Point And Figure Charting
- Point And Figure Charting.pdf
- Size: 190 kb
- Author: ohn A. Anderson | Language: English | Dir.: Part2 | Request Remove!
https://www.prof-fx.com/assets/ebook/part2/Point-And-Figure-Charting.pdf


