
Many forex traders appreciate the MACD indicator for its clarity and reliability, yet they often critique one specific aspect: its entry signals tend to appear after the move has already begun. Because of this slight lag—common among indicators derived from moving averages – some traders dismiss MACD entirely, believing it causes them to leave too many pips behind.
But that’s only part of the story. While the MACD’s confirmation-based signals are intentionally conservative, there is a lesser-known technique that allows traders to enter earlier, without waiting for the traditional MACD Line/Signal Line crossover.
This guide will show you exactly how earlier entries are possible using the MACD histogram—while keeping the context of trend direction and risk in focus.
Why MACD Is Considered a “Lagging” Indicator
The standard MACD entry occurs when the MACD Line crosses above or below the Signal Line in the direction of the broader Daily trend.
Because both lines are derived from Exponential Moving Averages (EMAs), the crossover naturally occurs after price has already started moving.
For many traders, this delayed signal is valuable because it provides confirmation. For others—especially aggressive traders seeking early positioning—it can feel limiting.
If you fall into the second group, the MACD histogram offers an alternative.
Using the MACD Histogram for Earlier Trade Entries
Now let’s look at how traders can read the histogram bars to identify a shift in momentum before the crossover happens.
Below is an example using a 1-hour chart of EURUSD:
When price begins to move downward, the green histogram bars typically start to shorten.
As soon as a histogram bar fails to close above the previous one, this indicates a loss of bullish momentum at that moment in time.
Aggressive Entry Approach
An aggressive trader may interpret the first shorter histogram bar as a signal that:
- Upward movement is weakening
- Bearish pressure is emerging
- A short position may be justified before the official crossover
This allows a much earlier entry compared to waiting for the MACD Line/Signal Line confirmation.
A More Conservative Histogram-Based Technique
Not all traders want the extremely early entry mentioned above.
Some prefer early, but with more structure and reliability.
For these traders, a common approach is to wait for 3–5 consecutive histogram bars that continuously close:
- Lower (in a bearish move), or
- Higher (in a bullish move)
This provides stronger evidence of building momentum while still being earlier than a traditional crossover entry.
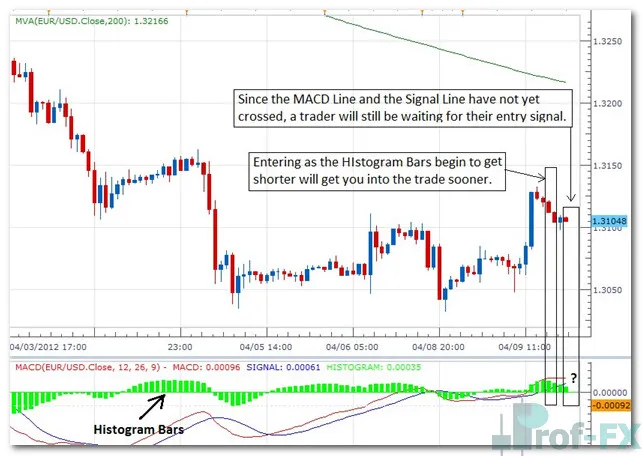
In the chart example, you’ll notice that:
- The bearish move had already started
- Multiple histogram bars were signaling momentum loss
- But the MACD Line had not yet crossed the Signal Line
Meaning:
A histogram-based entry would have placed the trader ahead of the traditional MACD crossover signal.
Comparing the Two MACD Entry Styles
1. Histogram Entry
- Fastest entry
- Ideal for aggressive momentum traders
- Less confirmation → higher risk
- Captures more of the move early
2. MACD Line/Signal Line Crossover
- Slower entry
- Ideal for conservative traders
- Provides confirmation of trend continuation
- Reduces the likelihood of entering too early
Both entry techniques are valid. The choice depends on your personal risk tolerance, trading style, and strategy framework.
A Crucial Reminder About Early Entries
Early entries come with a trade-off.
As discussed in research surrounding lagging indicators, entering earlier always means entering with less confirmation, which increases the chance of being wrong.
Indicators exist to help traders avoid premature or impulsive decisions.
If you choose to enter early using histogram signals, make sure it aligns with:
- Your risk management
- Your trend analysis
- Your stop-loss placement
- Your trading plan as a whole


