
One of the most common questions I hear from new traders is: “What is the best time frame to trade forex?”
It’s a fair question—and an important one. However, after more than 15 years trading and teaching in the forex market, I can confidently say this: there is no single “best” time frame for everyone.
The ideal forex time frame depends on your trading strategy, personality, risk tolerance, and availability. Professional traders use different time frames for different purposes, typically separating trend identification from trade execution. In this article, I’ll walk you through the major forex trading time frames, explain how professionals use them, and help you determine which approach best aligns with your trading goals.
Key Topics Covered in This Guide
- How to choose the best forex time frame for your strategy
- The main forex trading time frames explained
- Position trading vs swing trading vs day trading
- How professionals use multiple time frame analysis
How to Choose the Best Time Frame to Trade Forex
The best forex time frame is determined by how long you want to hold trades and how actively you want to trade. Most professional traders divide chart analysis into two core components:
- Trend charts: Higher time frames used to identify overall market direction
- Trigger charts: Lower time frames used to pinpoint precise entry and exit points
Below is a simplified comparison of how different trading styles typically use time frames:
Forex Time Frame Comparison by Trading Style
| Trading Style | Trend Chart | Trigger Chart |
| Day Trading | Hours to Daily | Seconds to Minutes |
| Swing Trading | Weekly to Monthly | Hours to Daily |
| Position Trading | Monthly to Yearly | Daily to Weekly |
This structure helps traders stay aligned with the broader market while improving entry timing and risk management.
Main Forex Trading Time Frames Explained
Different trading styles require different chart perspectives. Let’s break them down one by one, starting with the longest-term approach.
1) Position Trading Time Frames (Long-Term Trading)
Position trading is a long-term strategy where trades may last from weeks to months—or even years. While many new traders avoid this approach due to the patience required, long-term trading often offers clearer trends, fewer false signals, and reduced emotional pressure.
From an academic and professional standpoint, position trading is often easier to execute consistently than short-term trading, which demands rapid decision-making and near-perfect execution.
Typical Charts Used in Position Trading
- Monthly chart: Identify the dominant market trend
- Weekly chart: Locate strategic entry points
Position Trading Example
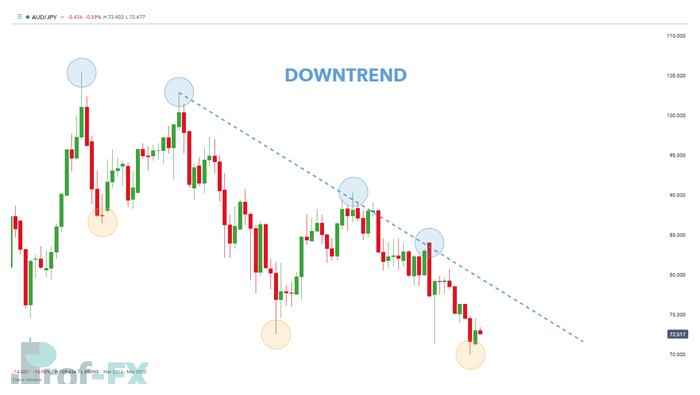
After identifying a bearish trend on the monthly chart—characterized by lower highs and lower lows—a trader looks for confirmation and entries on the weekly chart.
Monthly AUD/JPY trend chart:
Weekly AUD/JPY trigger chart:

Many traders rely on price action, support and resistance levels, or long-term technical indicators when trading this style. Importantly, position trading allows traders to ignore short-term market noise and focus on macroeconomic themes such as interest rates, central bank policy, inflation data, and economic cycles.
2) Swing Trading Time Frames (Medium-Term Trading)
Swing trading sits comfortably between long-term position trading and short-term day trading. It’s one of the most popular trading styles among retail and professional traders because it balances time efficiency, opportunity frequency, and risk control.
Swing traders typically check the market a few times per day, rather than watching charts constantly. This makes it ideal for traders who cannot monitor the market full-time.
Typical Charts Used in Swing Trading
- Daily chart: Identify the overall trend and market structure
- 4-hour chart: Identify trade entries and manage risk
Swing traders usually trade pullbacks in the direction of the prevailing trend, which aligns well with institutional trading behavior.
Swing Trading Example
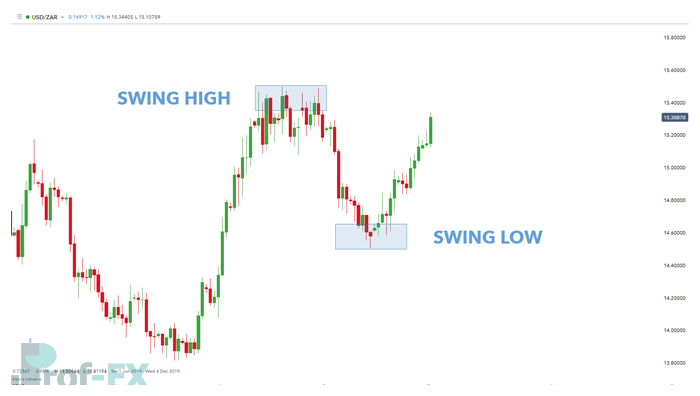
In the example below, the daily chart highlights an uptrend through higher swing highs and higher swing lows. Once the trend direction is clear, the trader moves to the 4-hour chart to look for entry opportunities near key resistance or support levels.
Daily USD/ZAR trend chart:
4-hour USD/ZAR trigger chart:
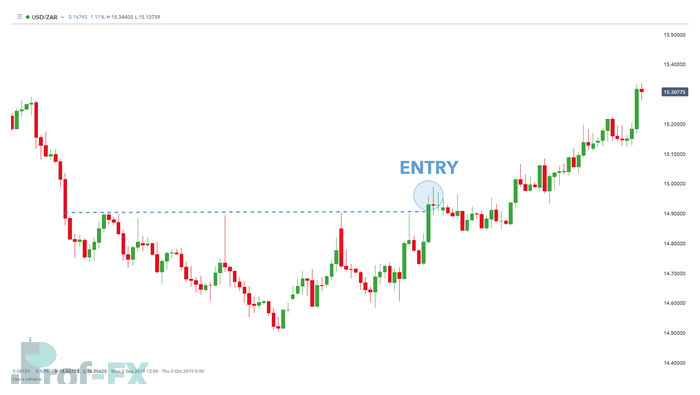
This approach allows traders to capture meaningful price movements without the stress and randomness often found on very short time frames.
3) Day Trading Time Frames (Short-Term Trading)
Day trading is one of the most challenging forex trading styles to master. Positions are opened and closed within the same trading day, requiring speed, discipline, and emotional control.
New traders often underestimate how demanding day trading can be. Frequent decisions, tight stop-loss levels, and market noise increase the probability of errors—especially without sufficient experience.
Typical Charts Used in Day Trading
- Hourly chart: Identify the intraday trend
- 5-minute or 10-minute chart: Execute trades
- 1-minute chart: Optional, but extremely risky due to randomness
Because profit targets are smaller, day traders must use tight stop-losses, which increases the likelihood of being stopped out prematurely.
Day Trading Example
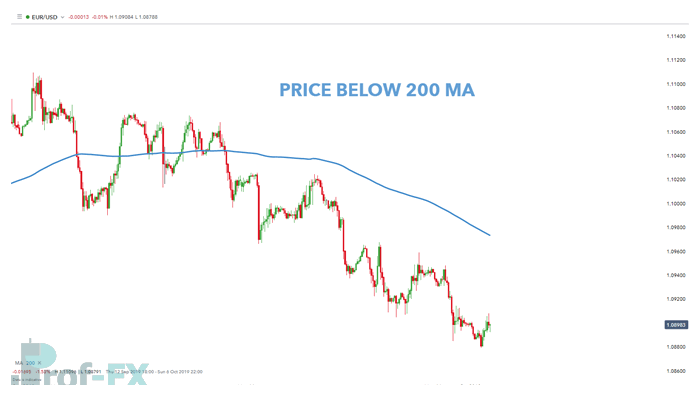
In this example, the hourly chart shows price trading below the 200-period moving average, signaling a bearish trend. The trader then uses a 10-minute chart with the RSI indicator to identify overbought conditions in alignment with the dominant downtrend.
Hourly EUR/USD trend chart:
10-minute EUR/USD trigger chart:
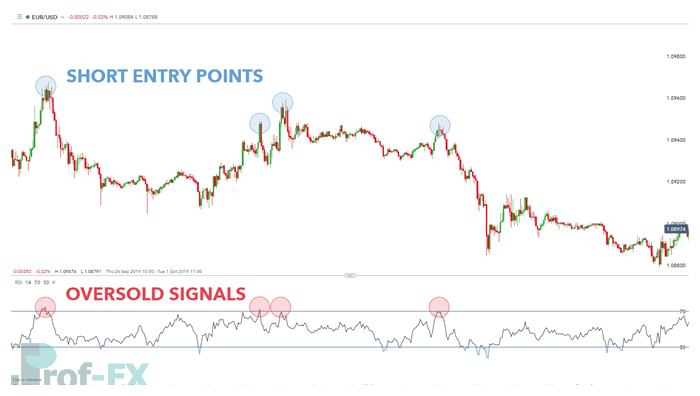
This trend-aligned approach helps reduce countertrend trades, which are a common cause of losses among new day traders.
Using Multiple Time Frame Analysis in Forex Trading
Professional forex traders almost never base decisions on a single chart. Relying on only one time frame often leads to misreading market context, entering trades too early, or trading against dominant market forces. Instead, experienced traders apply multiple time frame analysis (MTFA)—a structured approach that aligns market direction, timing, and risk control.
At its core, multiple time frame analysis is about seeing the market from different perspectives, much like zooming in and out on a map. Each time frame serves a distinct purpose in the decision-making process.
The Role of Higher Time Frames: Defining Market Direction
Higher time frames—such as the weekly or daily charts—are used to determine the primary trend and directional bias of the market. These charts filter out short-term noise and reflect the behavior of larger market participants, including institutional traders, hedge funds, and central-bank-driven flows.
From a professional standpoint, this step answers critical questions such as:
- Is the market trending or ranging?
- Are buyers or sellers in control?
- Where are major support and resistance zones located?
Trading in alignment with the higher time frame helps traders avoid countertrend trades, which statistically carry lower probability and higher psychological pressure.
The Role of Lower Time Frames: Precision and Execution
Once the broader market direction is established, traders shift to lower time frames—such as the 4-hour, 1-hour, or minute-based charts—to fine-tune trade execution. These charts are used to identify:
- Precise entry points
- Stop-loss placement
- Short-term momentum shifts
- Confirmation signals from price action or indicators
This step allows traders to enter trades with greater accuracy and improved risk-to-reward ratios, rather than chasing price movements.
Practical Example of Multiple Time Frame Alignment
A common professional framework looks like this:
- Weekly chart → Identifies long-term trend and key structural levels
- Daily chart → Confirms bias and refines support/resistance zones
- 4-hour or 1-hour chart → Identifies trade setups and entries
For example, if the weekly and daily charts both show a clear uptrend, the trader will only look for buy setups on the lower time frame. This directional alignment significantly improves trade consistency and reduces unnecessary losses.
Why Multiple Time Frame Analysis Improves Consistency
From both a trading and academic perspective, multiple time frame analysis offers several advantages:
- Better trade filtering: Fewer, higher-quality setups
- Improved risk management: More logical stop placement
- Reduced emotional trading: Clear rules and structure
- Higher probability trades: Alignment with dominant market forces
This approach also supports key forex entities such as trend structure, support and resistance, liquidity zones, volatility cycles, and institutional order flow, making it highly adaptable across different trading styles.
A Skill Every Developing Trader Should Master
For developing and beginner traders, mastering multiple time frame analysis is a foundational skill. It encourages patience, discipline, and strategic thinking—qualities that separate consistent traders from those who rely on impulse or single-chart signals.
In practice, the market may appear chaotic on a short-term chart. However, when viewed through the lens of higher time frames, structure and direction often become clear. This is precisely why multiple time frame analysis remains a cornerstone of professional forex trading across global financial markets.
Continue Learning Forex Trading
- Master the basics of forex time frames to refine your trading strategy
- If you’re new to the market, study a Forex Trading for Beginners guide to build a solid foundation
A well-chosen time frame won’t guarantee success—but choosing the wrong one for your personality almost guarantees frustration. Trade smart, trade patiently, and let the market work for you.


")


