
Understanding Price Action in Financial Markets
Price action refers to the direct study and interpretation of price movement in the market. Rather than relying solely on mathematical formulas or lagging indicators, price action focuses on what price itself is doing—how it moves, reacts, and behaves around key levels.
Professional traders use price action to form market bias, identify trends, locate important support and resistance zones, and define effective risk management levels. In practice, trend identification is almost always the first step in price action trading. Without a clear understanding of the prevailing trend, all other technical tools lose much of their effectiveness.
Price action analysis applies across all markets—forex, commodities, indices, and cryptocurrencies—and across all timeframes, from intraday charts to long-term investment horizons.
Why Price Action Should Be Your First Indicator
In technical analysis, most trading setups naturally begin with price action. The most important principle to remember is this:
Every technical indicator is derived from price.
Indicators do not lead price—price leads indicators. Moving averages, oscillators, and momentum tools are all mathematical interpretations of past price behavior. As a result, price action should always be analyzed before consulting any indicator.
A disciplined trader first determines:
- Market structure (trend or range)
- Directional bias (bullish, bearish, or neutral)
- Key price levels (support, resistance, swing highs, swing lows)
Only after this foundation is established should indicators be used to assist with timing entries, managing trades, or confirming momentum.
Traders ultimately trade price—not indicator values. This is why many professional traders rely primarily on price action, while using indicators as a secondary confirmation tool rather than a decision-maker.
The Relationship Between Price Action and Technical Indicators
Technical indicators are best understood as supporting tools, not primary signals. They are calculated using historical price data over specific periods, helping traders:
- Confirm trend direction
- Identify overbought or oversold conditions
- Fine-tune entries and exits
- Define stop-loss and take-profit distances
Trend identification remains central to this process. A market behaves very differently depending on whether it is trending, consolidating, or transitioning between phases. Indicators tend to perform best when aligned with the underlying price structure.
This is why experienced traders always analyze price action first—to understand how the market is functioning as a whole—before interpreting what an indicator is signaling.
Price Action in Practice: USD/ZAR Example
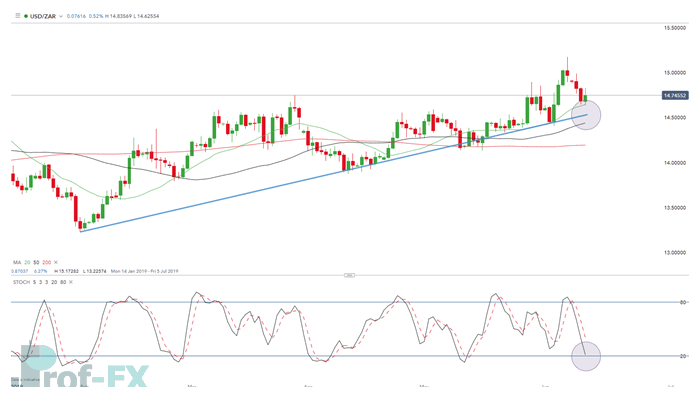
The USD/ZAR chart above demonstrates the symbiotic relationship between price action and technical indicators within a structured trade setup.
The analysis begins with price action:
- An uptrend is identified through a series of higher highs and higher lows.
- The rising trendline (blue) also acts as a dynamic support level, where price has repeatedly found buyers.
Next, indicators are introduced for confirmation:
- The 20, 50, and 200 moving averages are all positioned below price, reinforcing the bullish trend.
- The stochastic oscillator suggests the market is approaching oversold territory, indicating a potential continuation of the upward move rather than a reversal.
As price approaches the support zone, traders monitor both:
- Price behavior near the trendline
- Momentum signals from the stochastic oscillator
A long position may then be considered, with risk managed by placing a stop-loss below the support level—allowing price action, not the indicator, to dictate when the trade idea is invalidated.
Price Action vs Indicators: A Practical Summary
Price action is not a single strategy—it is a broad analytical framework that incorporates market structure, trends, volatility, and trader behavior. It provides context, while indicators provide precision.
Used together correctly:
- Price action defines direction and context
- Indicators refine timing and risk parameters
When indicators are used without price action, signals can be misleading. When price action is used without discipline, traders may lack consistency. The combination—anchored firmly in price behavior—is what leads to higher-quality trading decisions.
Improve Your Trading with Proven Education and Tools
If you are developing your skills as a forex trader, structured education and disciplined risk management are essential.
- New traders can start with our Forex for Beginners Guide
- Join our live trading webinars covering central banks, macroeconomic drivers, and technical patterns
- Track key macro events with the economic calendar
- Learn proper position sizing and capital protection with our risk management guides
- Explore the Traits of Successful Traders to understand the psychological edge behind long-term consistency
Prof FX provides in-depth forex news, price action analysis, and technical insights into the forces shaping global currency markets.


